The flagship · $499 lifetime
Footprint and order flow chart for NinjaTrader 8
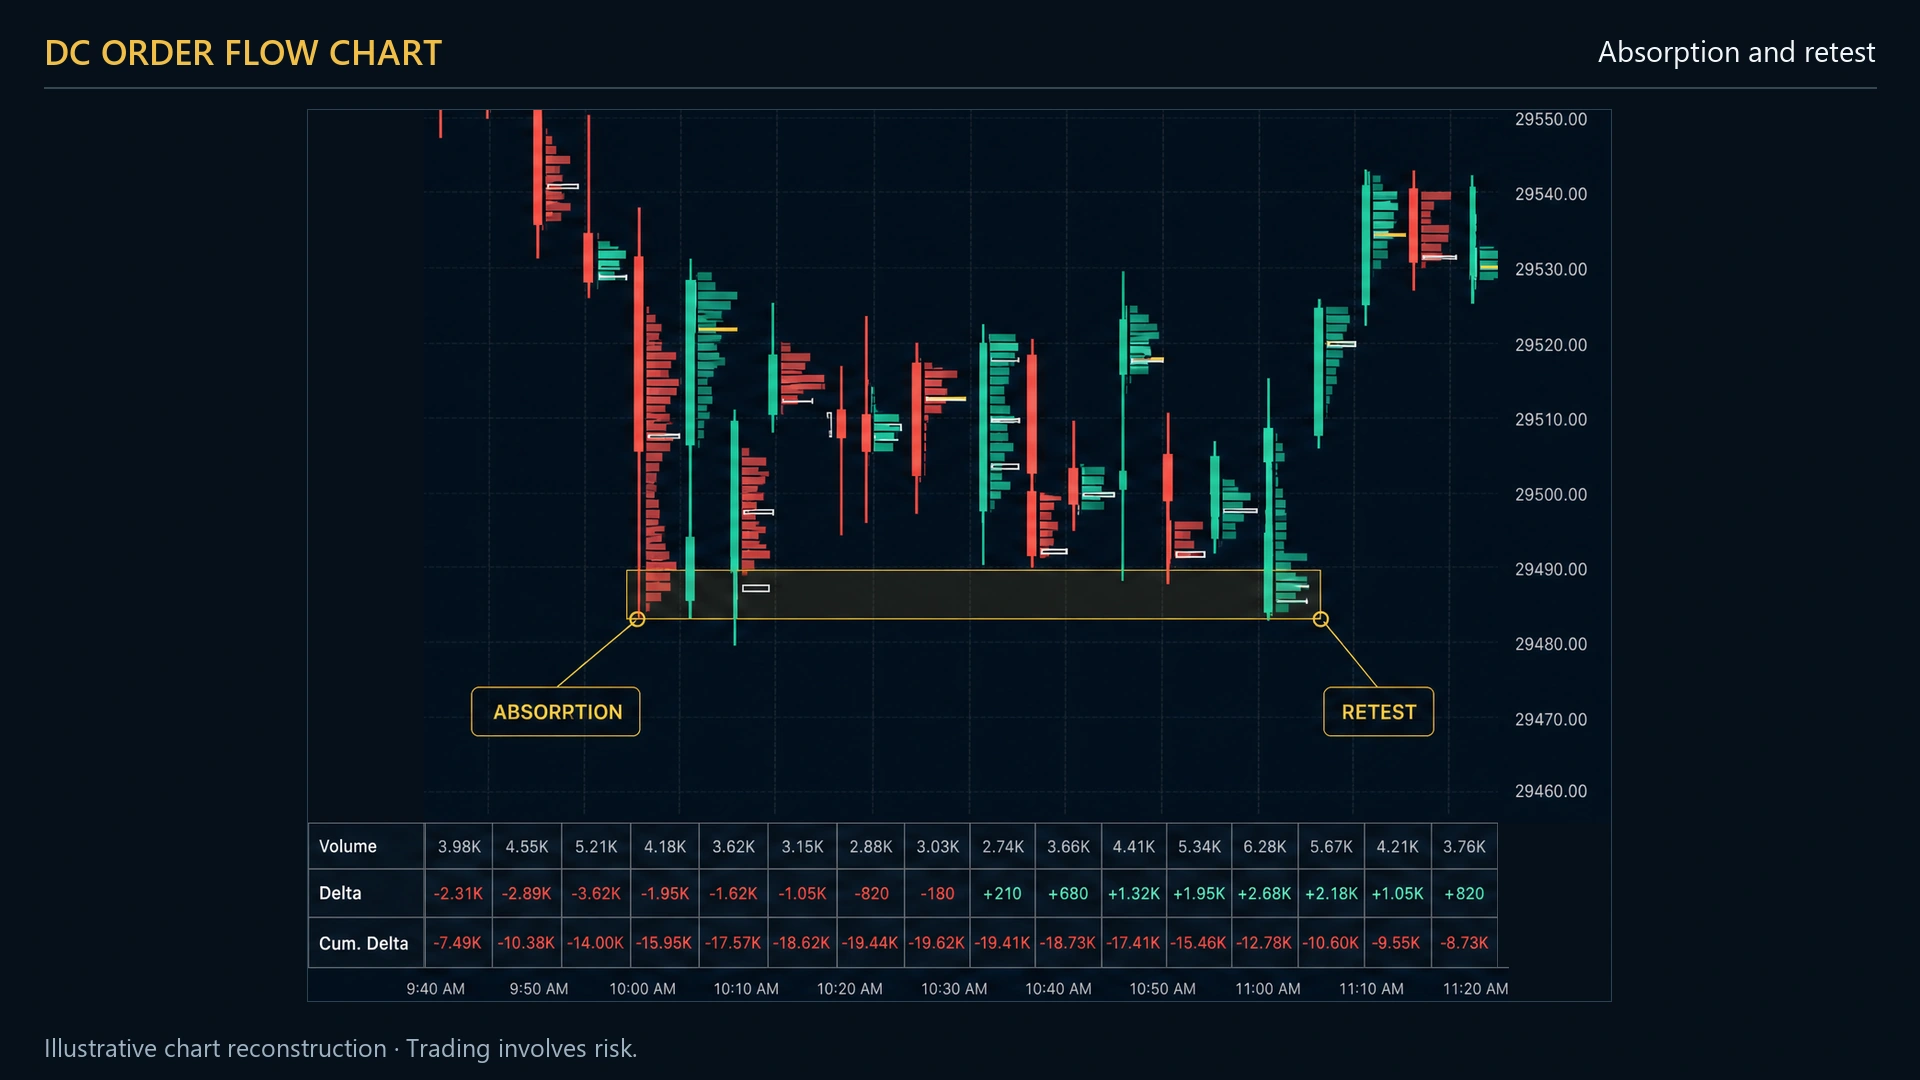
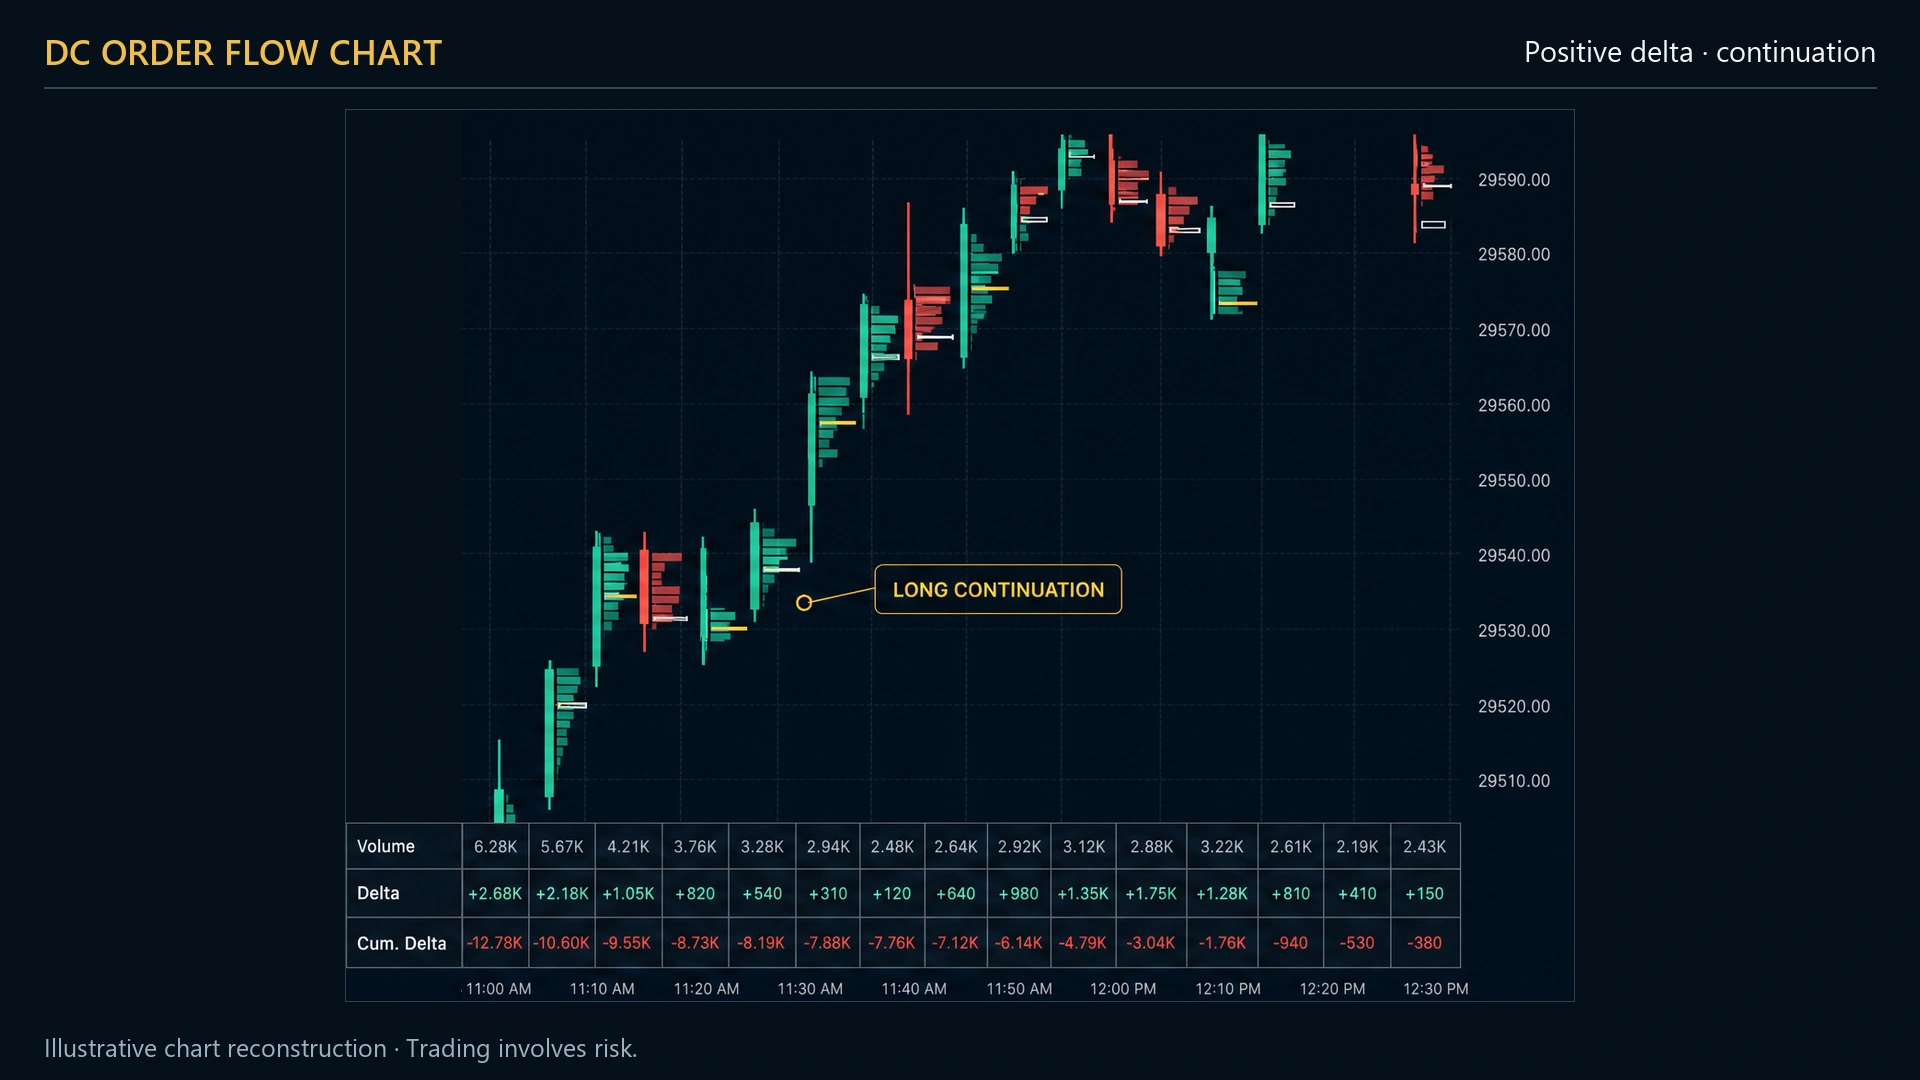
In short: DC OrderFlow Chart draws a volume profile inside every candle, coloured by delta, with the point of control boxed on each bar and a volume / delta / cumulative-delta table underneath. Imbalances become zones that keep extending until price breaks them, and large trades are marked at the exact execution price. One indicator, eighty settings, five ways to read a bar.
Key facts
| Platform | NinjaTrader 8, Windows |
|---|---|
| Order Flow+ required | Yes — it reads the volumetric bid/ask series |
| Tick Replay | Required for historical bars |
| Chart setup | On a normal 5-minute chart it adds a matching volumetric series internally |
| Profile modes | Volume · Delta · Volume coloured by delta · Value area profile · Value area zone |
| Settings | 80+ across 8 groups: Profile, POC, Text, Delta band, Candles, Colours, Big trades, Imbalance |
| Price | $499 one-time, lifetime updates, 3 machines |
What is a footprint chart?
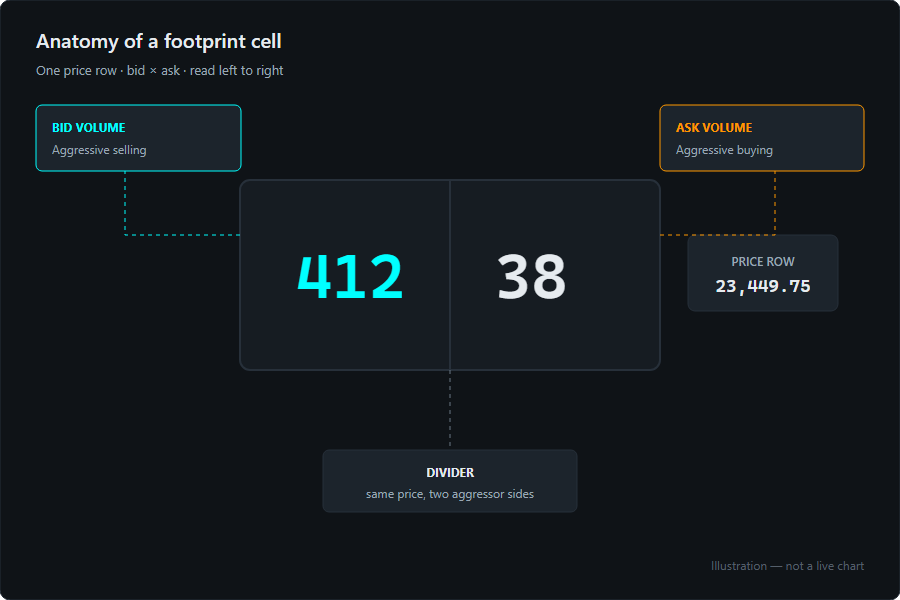
A footprint chart shows how much volume traded at each individual price inside a bar, split by which side was the aggressor. Instead of four numbers per bar — open, high, low, close — you see the distribution: where the auction concentrated its size, and whether buyers were lifting the ask or sellers were hitting the bid at each level.
Five ways to draw the inside of a bar
Different questions want different views, so the profile has five modes rather than one.
Volume
Raw volume at each price. The plainest read of where business was done.
Delta
Net aggression at each price. Shows who was crossing the spread, level by level.
Volume coloured by delta
Bar length is volume, colour is who was aggressive. Both readings at once.
Value area profile DEFAULT
Rows drawn only between the value area high and low. Cuts the tails and leaves the part of the bar that mattered.
Value area zone
No rows at all — just the VAH–VAL block coloured by the bar’s delta, plus the POC. The calmest view for a busy chart.
Overlay or side-by-side
Draw the profile on the candle or beside it. Value area defaults to 40%, four ticks per level.
Imbalance zones that stay useful
Most footprint tools mark an imbalance and then forget about it. Here a stack of imbalances becomes a zone that extends to the right until price actually breaks through it — with an option to hide zones once they are broken.
That is the difference between a historical annotation and a live level. An imbalance from forty bars ago is only interesting if price has not yet been back to test it, and the indicator is the thing that should be keeping track of that, not you.
Detection is diagonal by default — ask at one price against bid at the price below, the classic footprint convention — or horizontal, comparing the two sides at the same level. Default ratio 3.0, minimum volume 20.
Candles that carry the delta
The indicator can hide NinjaTrader’s own candles and draw its own, so the chart stays readable underneath the profile. Delta can be expressed five ways, and the outline always gives price direction while the fill gives aggressor pressure.
Off
Transparent body, outline on direction, fixed thickness.
Outline strength
Outline thickness scales with how one-sided the bar’s delta was.
Outline volume
Outline thickness scales with the bar’s total volume instead.
Body tint
The body colours with an intensity set by delta strength.
Body gauge
The body fills from the bottom in proportion to the percentage of aggressive buying. A bar half full was an even fight.
Delta table below
Volume, delta and cumulative delta, aligned under each bar — or a histogram, if you prefer the shape to the figure.
Numbers that appear only when they fit
Text mode is Auto, Always or Never. On Auto the figures appear only when a bar is wide enough to hold them, and the contrast is set automatically against whatever colour the row ended up. That is what keeps the chart calm at normal zoom instead of turning into a wall of digits.
Big trades, already included
Large executions are marked at the exact price they happened, sized by a clustering window so a burst of prints at one price counts as one event rather than fifteen. Minimum size 25 by default, 250 millisecond window, and absorbed big trades are ringed so you can see when size went in and price did not move.
DC Big Trade remains a separate product because it works as a standalone overlay on any chart, with session-aware thresholds and a live tuning panel. The layer here is the integrated version, for people already running the footprint.
What you need to run it
Historical accuracy needs Order Flow+ or a NinjaTrader Lifetime licence, which provides the volumetric bid/ask data. On a normal 5-minute chart the indicator adds a matching volumetric series internally, so you do not have to change your chart type. Old bars need Tick Replay switched on and the data reloaded.
Order Flow+ is included free with a NinjaTrader Lifetime licence and with most funded prop firm accounts, so a large share of traders already have it without realising. Standalone it is roughly $59 a month. Add CME real-time data at about $4 to $12 a month depending on how many exchanges you need. We receive none of that — it is stated here so nothing is a surprise later.
Start with the free one
DC POC Candle draws a single line: the highest-volume price inside each bar. This indicator draws the whole distribution. They are the same idea at two depths.
Run the free line for a few weeks. If you find yourself wanting to know not just where the volume concentrated but how it was spread and who was aggressive, that is when this one earns its price — and not before.
Frequently asked questions
Do I need to change my chart to a volumetric bar type?
No. On a normal 5-minute chart the indicator adds a matching volumetric series internally and reads from that, so your chart stays as you have it. If you already run Order Flow Volumetric bars it will use them directly.
Why is the profile empty on older bars?
Tick Replay is off, or the chart has not been reloaded since it was switched on. A closed bar stores only open, high, low, close and total volume, so the per-price detail has to be replayed from the tick stream. Enable it in Tools, Options, Market Data, set it to True in the chart's Data Series, then reload historical data.
Will it slow my chart down?
It has explicit performance controls: a cap on bars kept in memory, a visible-cutoff percentage so off-screen bars are not drawn, and a choice of normalising across the visible area or per bar. Reducing days-to-load is still the biggest lever on any Tick Replay chart.
Is this the same as NinjaTrader’s Order Flow+ volumetric bars?
No. Order Flow+ provides the data; this reads it and adds the interpretation — the five profile modes, the imbalance zones that persist until broken, the delta table, the custom candles and the integrated big trades. Think of Order Flow+ as the sensor and this as the instrument built on it.
How does it compare to buying several separate indicators?
The functions here are commonly sold as four different products elsewhere: a footprint, a stacked-imbalance tool, a big-trade detector and a delta candle. That is the reason for the price rather than an argument for it — judge it on the chart, not the comparison.
Can I buy it today?
Not yet. Checkout opens once the licensing client and payment provider are finished. Until then the founding list locks the price, and the free indicator is available immediately.
Lock the founder price
The complete suite — this indicator, the other nine, the copier and the Telegram agent — at $1,845 instead of $3,075, for the first fifty. No payment taken today.