Free, permanently · no feature gate
POC candle indicator for NinjaTrader 8
In short: DC POC Candle draws one horizontal line inside every candle, at the price where the most contracts traded in that bar. The candle stays a normal candle. It works on any bar type, needs no Order Flow+ licence, and costs nothing.
NinjaTrader 8 · Windows · 3 machines · Tick Replay needed only for historical bars
What is a POC candle?
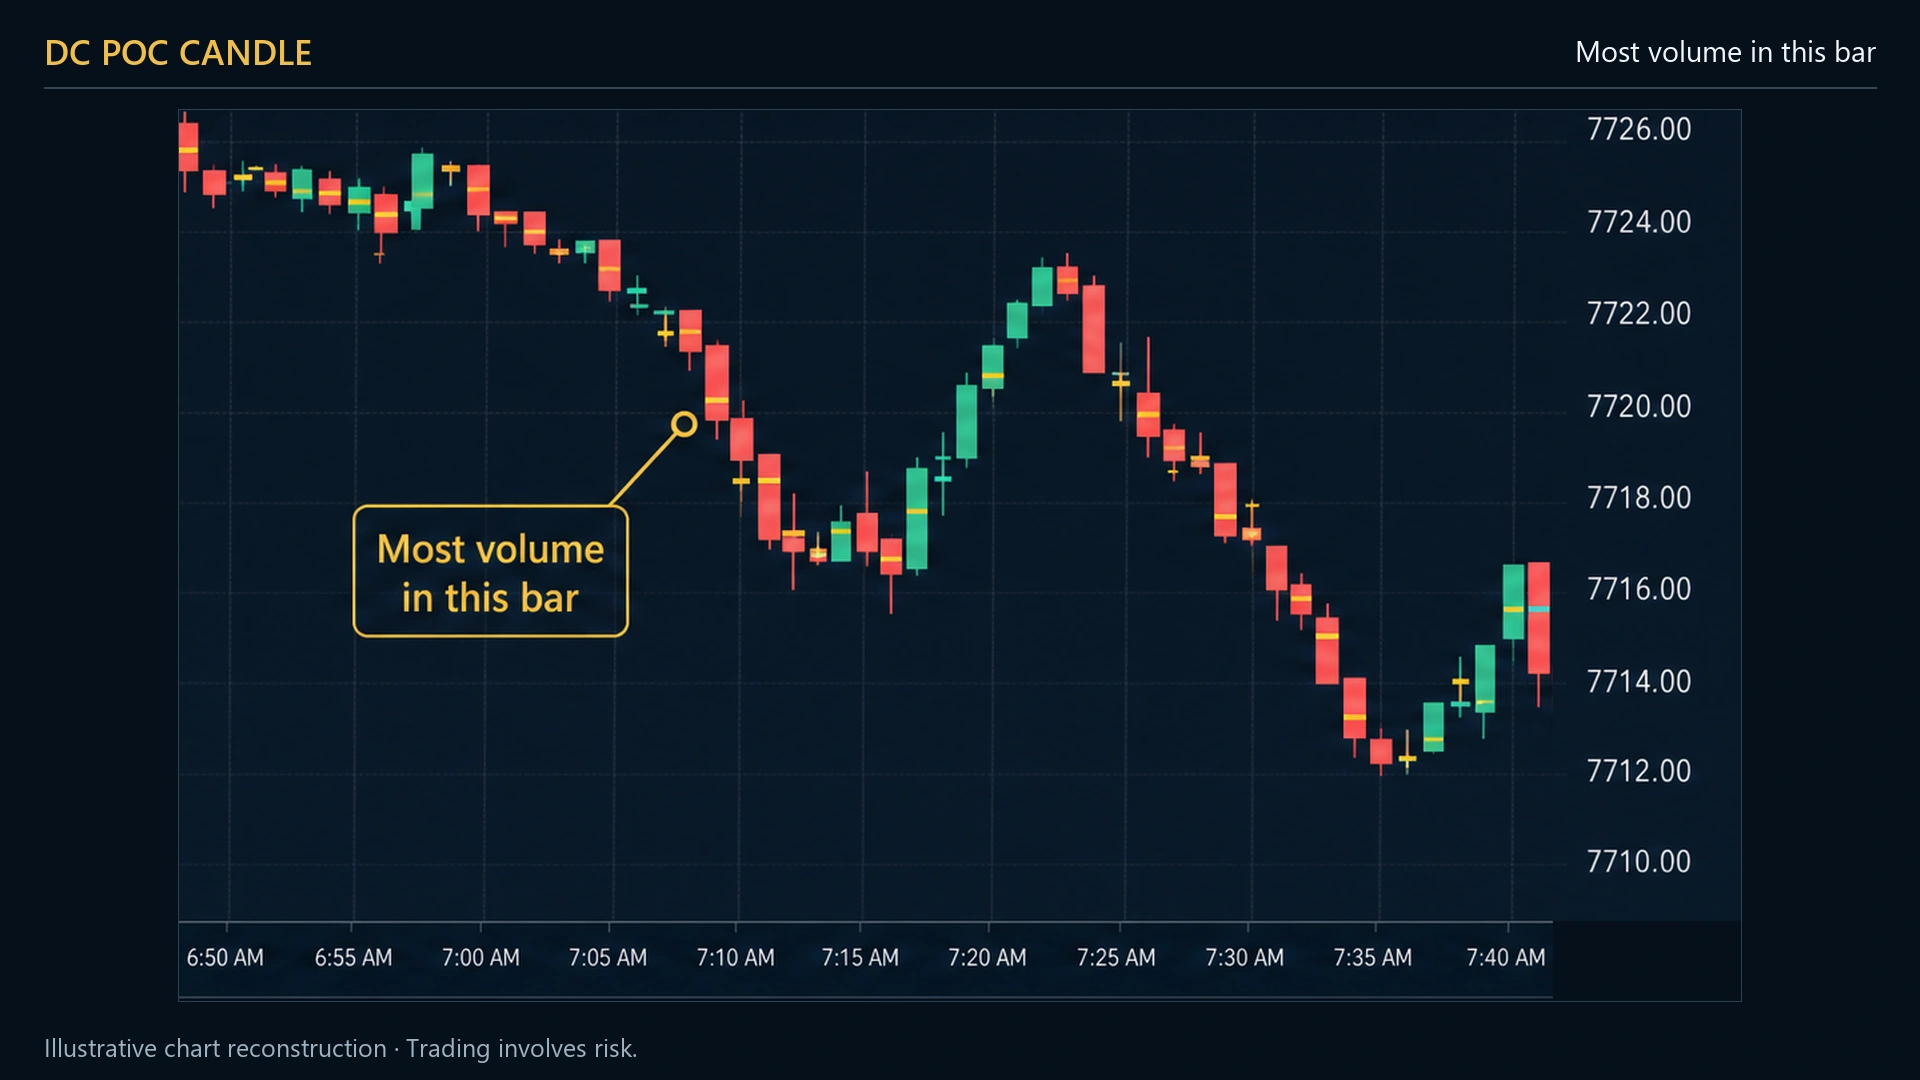
The point of control of a single candle is the price at which the most volume traded inside that bar. A POC candle indicator draws that price as a short horizontal line within the candle, so you can see where the auction actually spent its size rather than only where the bar opened and closed. The candle itself is unchanged — it does not become a footprint.
Why the POC of a single bar matters
A candle tells you four prices: open, high, low and close. None of them is where the trading happened. A bar can close at its high while almost all of its volume traded near the low — and those two readings imply very different things about who is in control.
Where is the bar’s centre of gravity?
Volume near the low of an up-bar means the move was built on a base. Volume near the high means it was chased. Same candle, opposite implication.
Is the POC migrating?
A run of bars whose POCs step steadily in one direction is a very different market from a run whose POCs sit at the same price.
Acceptance or rejection?
Bars whose POCs cluster at one price mark acceptance. A bar whose POC sits far from its close usually marks rejection.
Key facts
| Platform | NinjaTrader 8, Windows |
|---|---|
| Order Flow+ required | No — it builds its own volume-at-price map from the tick stream |
| Tick Replay | Only for historical bars. Real time works with no special setup. |
| Bar types | Any — minute, tick, second, volume, range, Renko |
| What it draws | One horizontal line per candle. Nothing else. |
| Settings | Line colour, width and opacity; save as default for every chart |
| Price | Free, permanently — no trial period, no locked settings |
| Licence | Free licence key, 3 machines |
Works on any bar type
Minute, tick, second, volume, range, Renko — all of them. The indicator accumulates volume at each price inside the bar as it forms, so it never depends on a particular chart construction. That is unusual: most profile-based tools require a specific bar type to work at all.
The POC button on the chart toolbar
A POC button appears on the chart toolbar. One click hides every line, one click brings them back. When you want a clean chart for a screenshot or a moment of thinking, you do not have to remove the indicator and re-add it afterwards.
Why are the lines missing on older bars?
Because Tick Replay is off. In real time the indicator works from the moment you add it. For bars that closed before you loaded it, NinjaTrader has to replay the ticks — otherwise there is simply no record of where volume traded inside a bar that has already closed.
There is no workaround for this in any platform; it is the nature of the data. Turn Tick Replay on, reload historical data, and the lines appear on history too.
Enabling it takes three steps. In the Control Center open Tools › Options › Market Data and tick Show Tick Replay. Then right-click the chart, open Data Series, and set Tick Replay to True. Finally right-click the chart and choose Reload All Historical Data — that third step is the one people skip, and then conclude Tick Replay does not work.
POC candle vs VPOC vs naked POC
These three terms get mixed up constantly. They are not the same thing, and the difference is only about which period is being profiled.
| Term | What it means | Period |
|---|---|---|
| POC candle | The highest-volume price inside one bar | One bar |
| VPOC / session POC | The highest-volume price of a whole session or profile | A session or day |
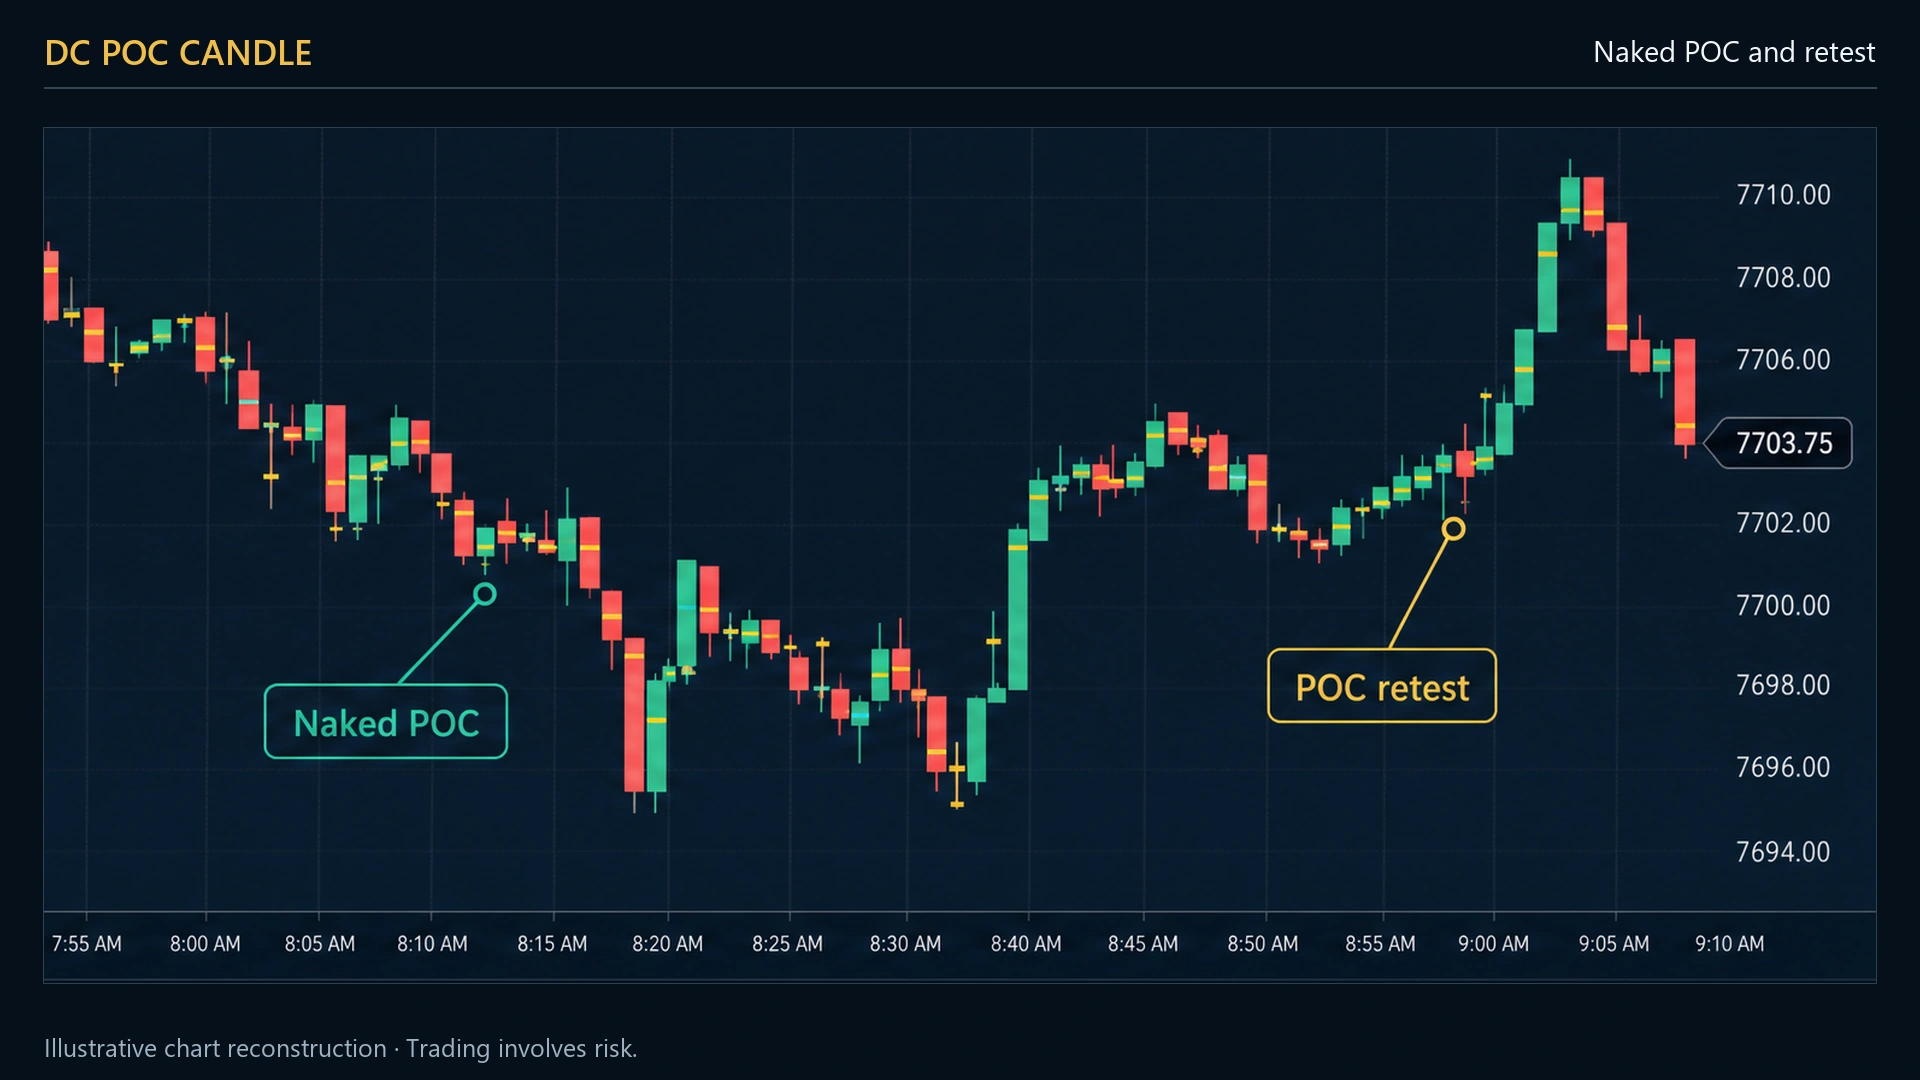
| Naked POC | A session POC that price has never traded back to since it formed | Historical, untested |
DC POC Candle draws the first. The other two are drawn by our levels and volume profile tools, including naked-level detection.
How to install it
Enter your email below and the file arrives immediately, with your free licence key.
In NinjaTrader: Tools › Import › NinjaScript Add-On and select the file.
Right-click a chart, choose Indicators, find DC POC Candle, click Add.
For lines on older bars, switch Tick Replay on and reload the data.
Get DC POC Candle
One field. The file and your licence key arrive immediately.
The second box is optional. Leave it unticked and you get the file and nothing else — that is a promise, not a setting.
What this is the free version of
DC POC Candle draws one line: the single highest-volume price in a bar. DC OrderFlow Chart draws the whole distribution — a volume profile inside every candle, coloured by delta, with imbalance zones and big trades on top.
They are the same idea at two depths, and we would rather say so than pretend they are unrelated products. Run the free line for a few weeks first. If you find yourself wanting to know not just where the volume concentrated but how it was distributed and who was aggressive, that is the moment the paid one makes sense — and not before.
Frequently asked questions
Is it really free?
Yes. No trial period, no locked settings, no watermark on your chart. It is free because it is how most people first meet DC TradeLab, and because it is cheap for us to support.
Do I need Order Flow+ for this?
No. This indicator builds its own volume-at-price map from the tick stream, so a standard NinjaTrader data connection is enough. That is not true of our absorption and big-trade indicators, which need the volumetric data series.
Does it slow the chart down?
It keeps a volume map per bar and prunes old ones as the chart scrolls, so memory stays flat. On a normal number of loaded days you will not notice it.
Can I change the line colour and width?
Yes — colour, width and opacity are all settable, and you can save your preference as the default for every chart.
Does it work on Renko bars?
Yes. Volume is accumulated price by price inside whatever bar is currently forming, so the bar construction does not matter. This is one of the few volume tools that holds up on Renko.
What happens to my email address?
It is used to send you the file and your licence key. The follow-up sequence is a separate, optional consent — if you leave that box unticked you receive the download and nothing further.