$349 lifetime
Absorption indicator for NinjaTrader 8
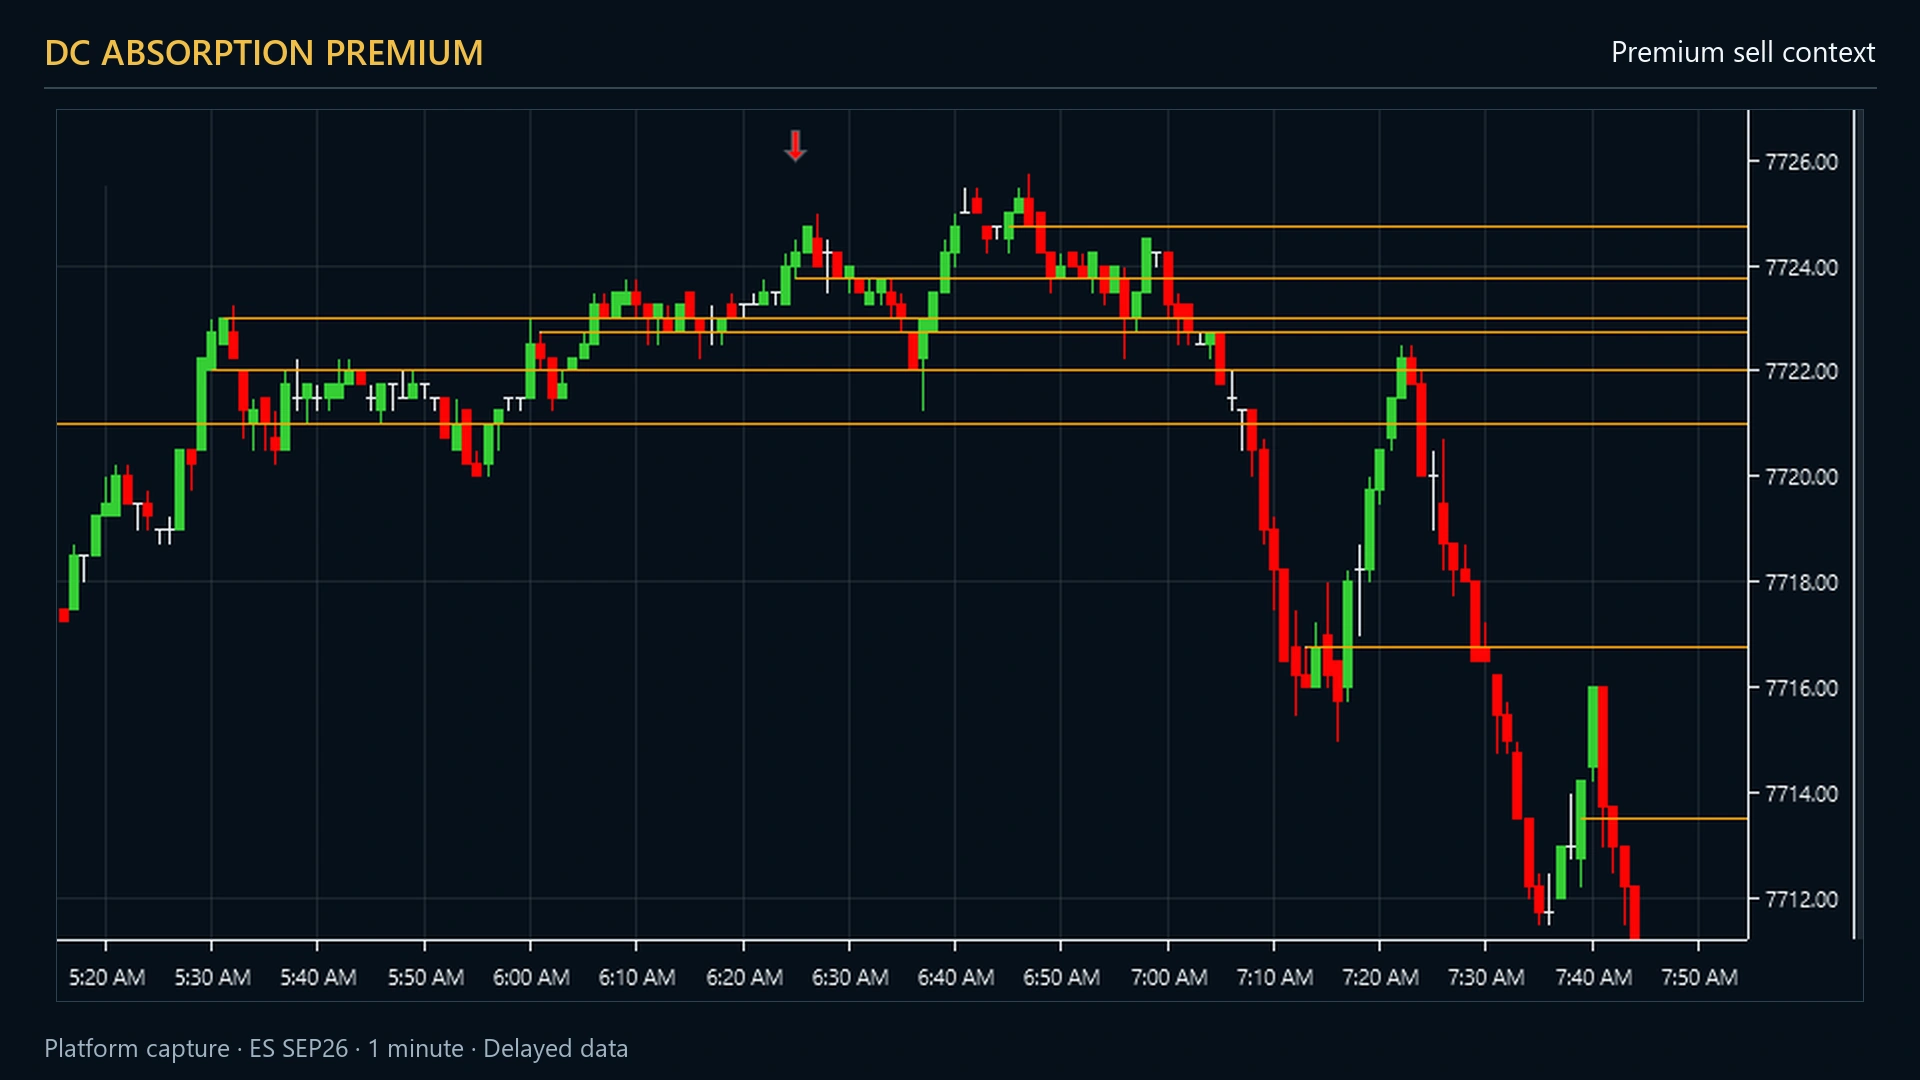
In short: DC Absorption Premium prints one arrow when — and only when — enough independent things agree at an absorption level. Below the threshold it draws nothing at all. No statistics panel, no probability, no CSV. Just the signal, and a chart you can still read.
An arrow only where several things agree
A quiet chart is the point. This indicator marks the moments where absorption is not standing alone, so the few marks you get are ones worth reading.
Absorption tells you where one side was absorbed and could not move price. That is structure: an objective level, drawn by the market rather than by an opinion, that you can build a decision around. It is not, on its own, a reason to act — and neither is one confirmation added to it. So this indicator waits for absorption, a volume reversal and a big trade to be present at the same moment before it draws anything, and it leaves the decision that follows to you.
It is also why the threshold matters more than the number of arrows. Every mark costs commission and spread to act on, so a tool that marks less asks less of your discipline, not more.
That design came out of our own logged order flow on three instruments, read with the caution historical data deserves: it is read with hindsight, it carries no execution cost, and it never once failed to fill. So this site publishes no win rate and no profit figure — we describe what the instrument draws, and you test it on your own instrument and timeframe.
What gets scored
Six components, each with an adjustable weight, so you can tune the engine to what you actually trade rather than to what somebody else does.
Absorption anchor
The level itself — one side’s aggression absorbed at a single price, found in the footprint with a vertical bid-versus-ask test.
Volume reversal
N candles in one direction followed by a reversal candle.
Big trade
A large print at the level — and whether it was absorbed or not, which are different messages.
RSI divergence
Classic or hidden.
Volume climax
A volume spike measured against its moving average.
Fresh extreme
The level formed recently and this is an early touch.
That last one is not decoration. In our logged data, three traits kept appearing together at the levels worth a second look: large aggressive flow on the signal bar (absolute delta well above its own average), a fresh level (age one to three bars, touch count one or less), and active session hours — the overwhelming majority of them formed while the session was open rather than overnight. The score is built out of those three, so the context arrives with the level instead of after it.
A level that has been worked many times, touched with no flow, outside session hours, is weak context. The score reflects that instead of leaving you to notice it.
Why a score and not a checklist
A checklist forces every condition to be true, which means you take almost no trades and the ones you do take are not necessarily better. A weighted score lets a very strong big trade compensate for a merely adequate volume reversal, while still refusing a setup where nothing much is happening.
You tune the weights to your instrument and your session; the threshold decides how selective you are. If you are getting dozens of arrows a day, the threshold is too low and you are trading noise — tuned for NQ scalping on a five-minute chart, a handful per session is normal.
What it deliberately does not do
It does not compute probabilities, simulate historical outcomes, write a CSV or draw a statistics panel. Mixing measurement into a signal indicator is how charts become unreadable. Premium shows you where the flow lines up. The decision is yours.
Premium or Levels — which one?
| DC Absorption Levels | DC Absorption Premium | |
|---|---|---|
| What you get | Every absorption level on the chart | One arrow when context aligns |
| Best for | Building the map, reading it yourself | Knowing your setup and wanting it flagged |
| On-chart weight | Lines | Arrows |
| Price | $299 | $349 |
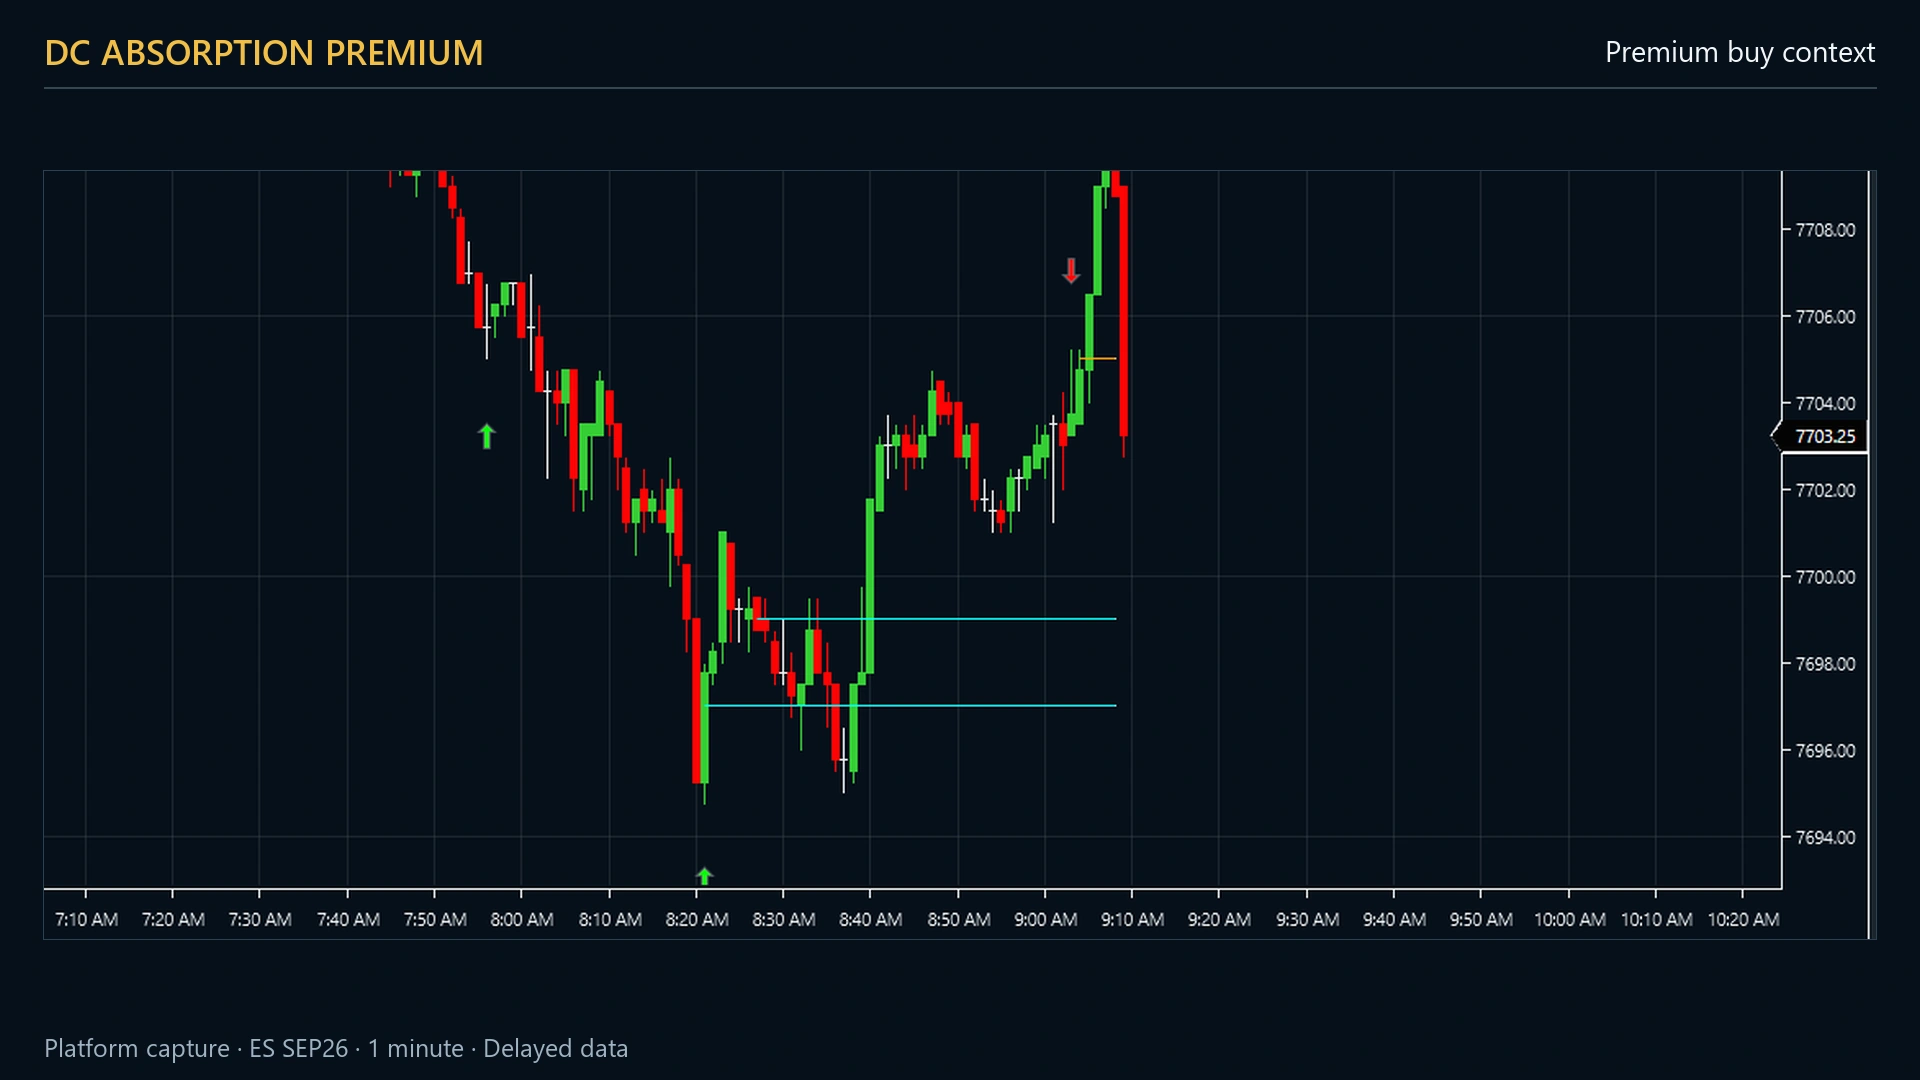
Most people run both — Levels draws the map, Premium marks the moment. They are designed to sit on the same chart.
Key facts
| Platform | NinjaTrader 8, Windows |
|---|---|
| Order Flow+ required | Yes |
| Tick Replay | Required for historical signals |
| Bar types | Minute, tick, second, volume, range or Order Flow Volumetric |
| Output | Arrows only — no panel, no file output |
| Runs alongside | DC Absorption Levels and DC Big Trade, on the same chart |
| Price | $349 one-time, lifetime updates, 3 machines |
Frequently asked questions
What is absorption in order flow?
Absorption is aggressive market orders being filled by resting limit orders without price moving away. Heavy selling hits the bid at one price, the sellers all get filled, and price holds — the sellers were absorbed, and that price becomes a support candidate.
How many signals should I expect per day?
Entirely a function of your threshold. Tuned for scalping NQ on a five-minute chart, a handful per session is normal. Dozens means the threshold is too low.
Does it repaint?
The score is evaluated on the signal bar. Signals are placed at the level and are not moved afterwards.
Does it place trades?
No. None of these tools place, modify or manage orders. They are analysis tools; you execute.
Why is nothing appearing on historical bars?
Tick Replay is off, or the chart has not been reloaded since it was switched on. Absorption is computed from volume at each price inside a bar, which only exists in the tick stream once the bar has closed.
Can I buy it today?
Not yet. Checkout opens once the licensing client and payment provider are finished. The founding list locks a lower price until then.
Lock the founder price
All ten indicators, the copier and the Telegram agent, lifetime, at $1,845 for the first fifty. No payment taken today.