$299 lifetime
Absorption levels for NinjaTrader 8
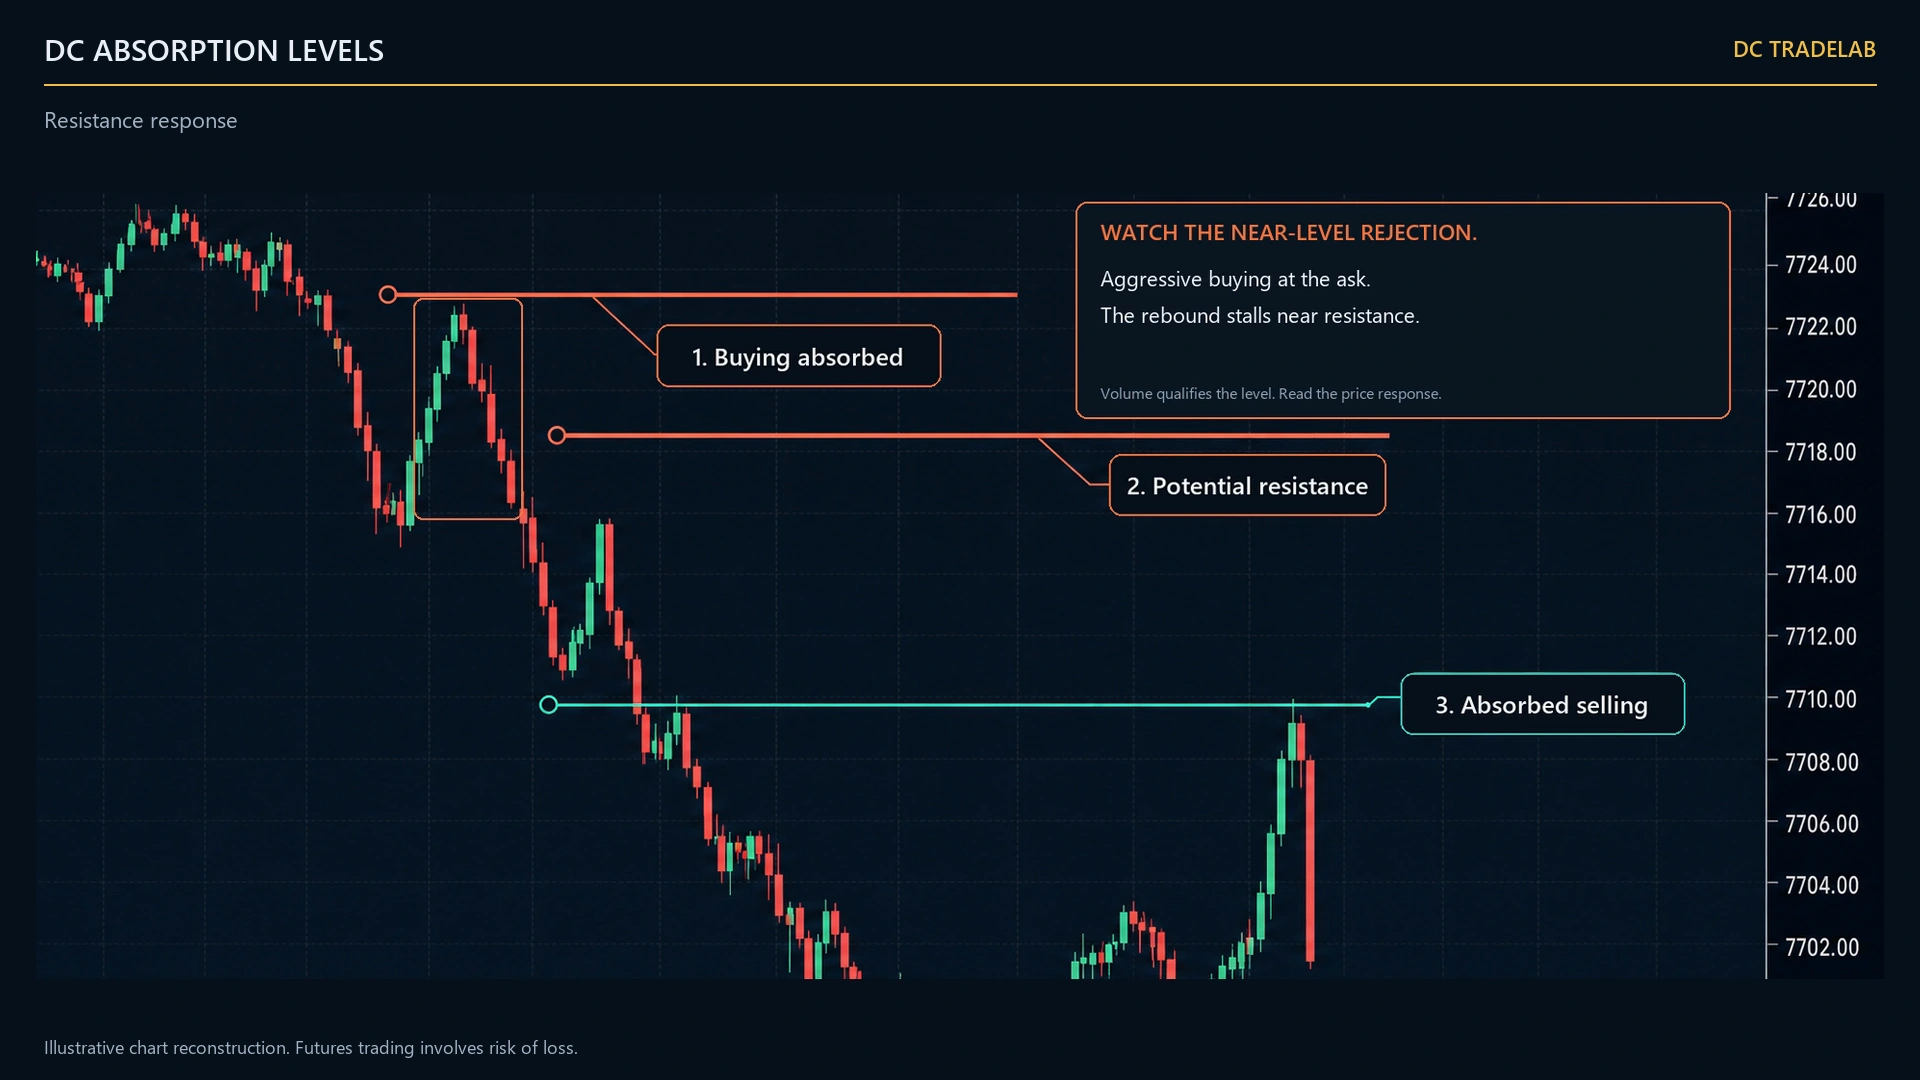
In short: DC Absorption Levels reads the volumetric footprint and draws a horizontal line at every price where one side’s aggression was absorbed by resting limit orders. Cyan below price means aggressive selling was eaten — a support candidate. Orange above means aggressive buying was. Lines extend right until price trades through them.
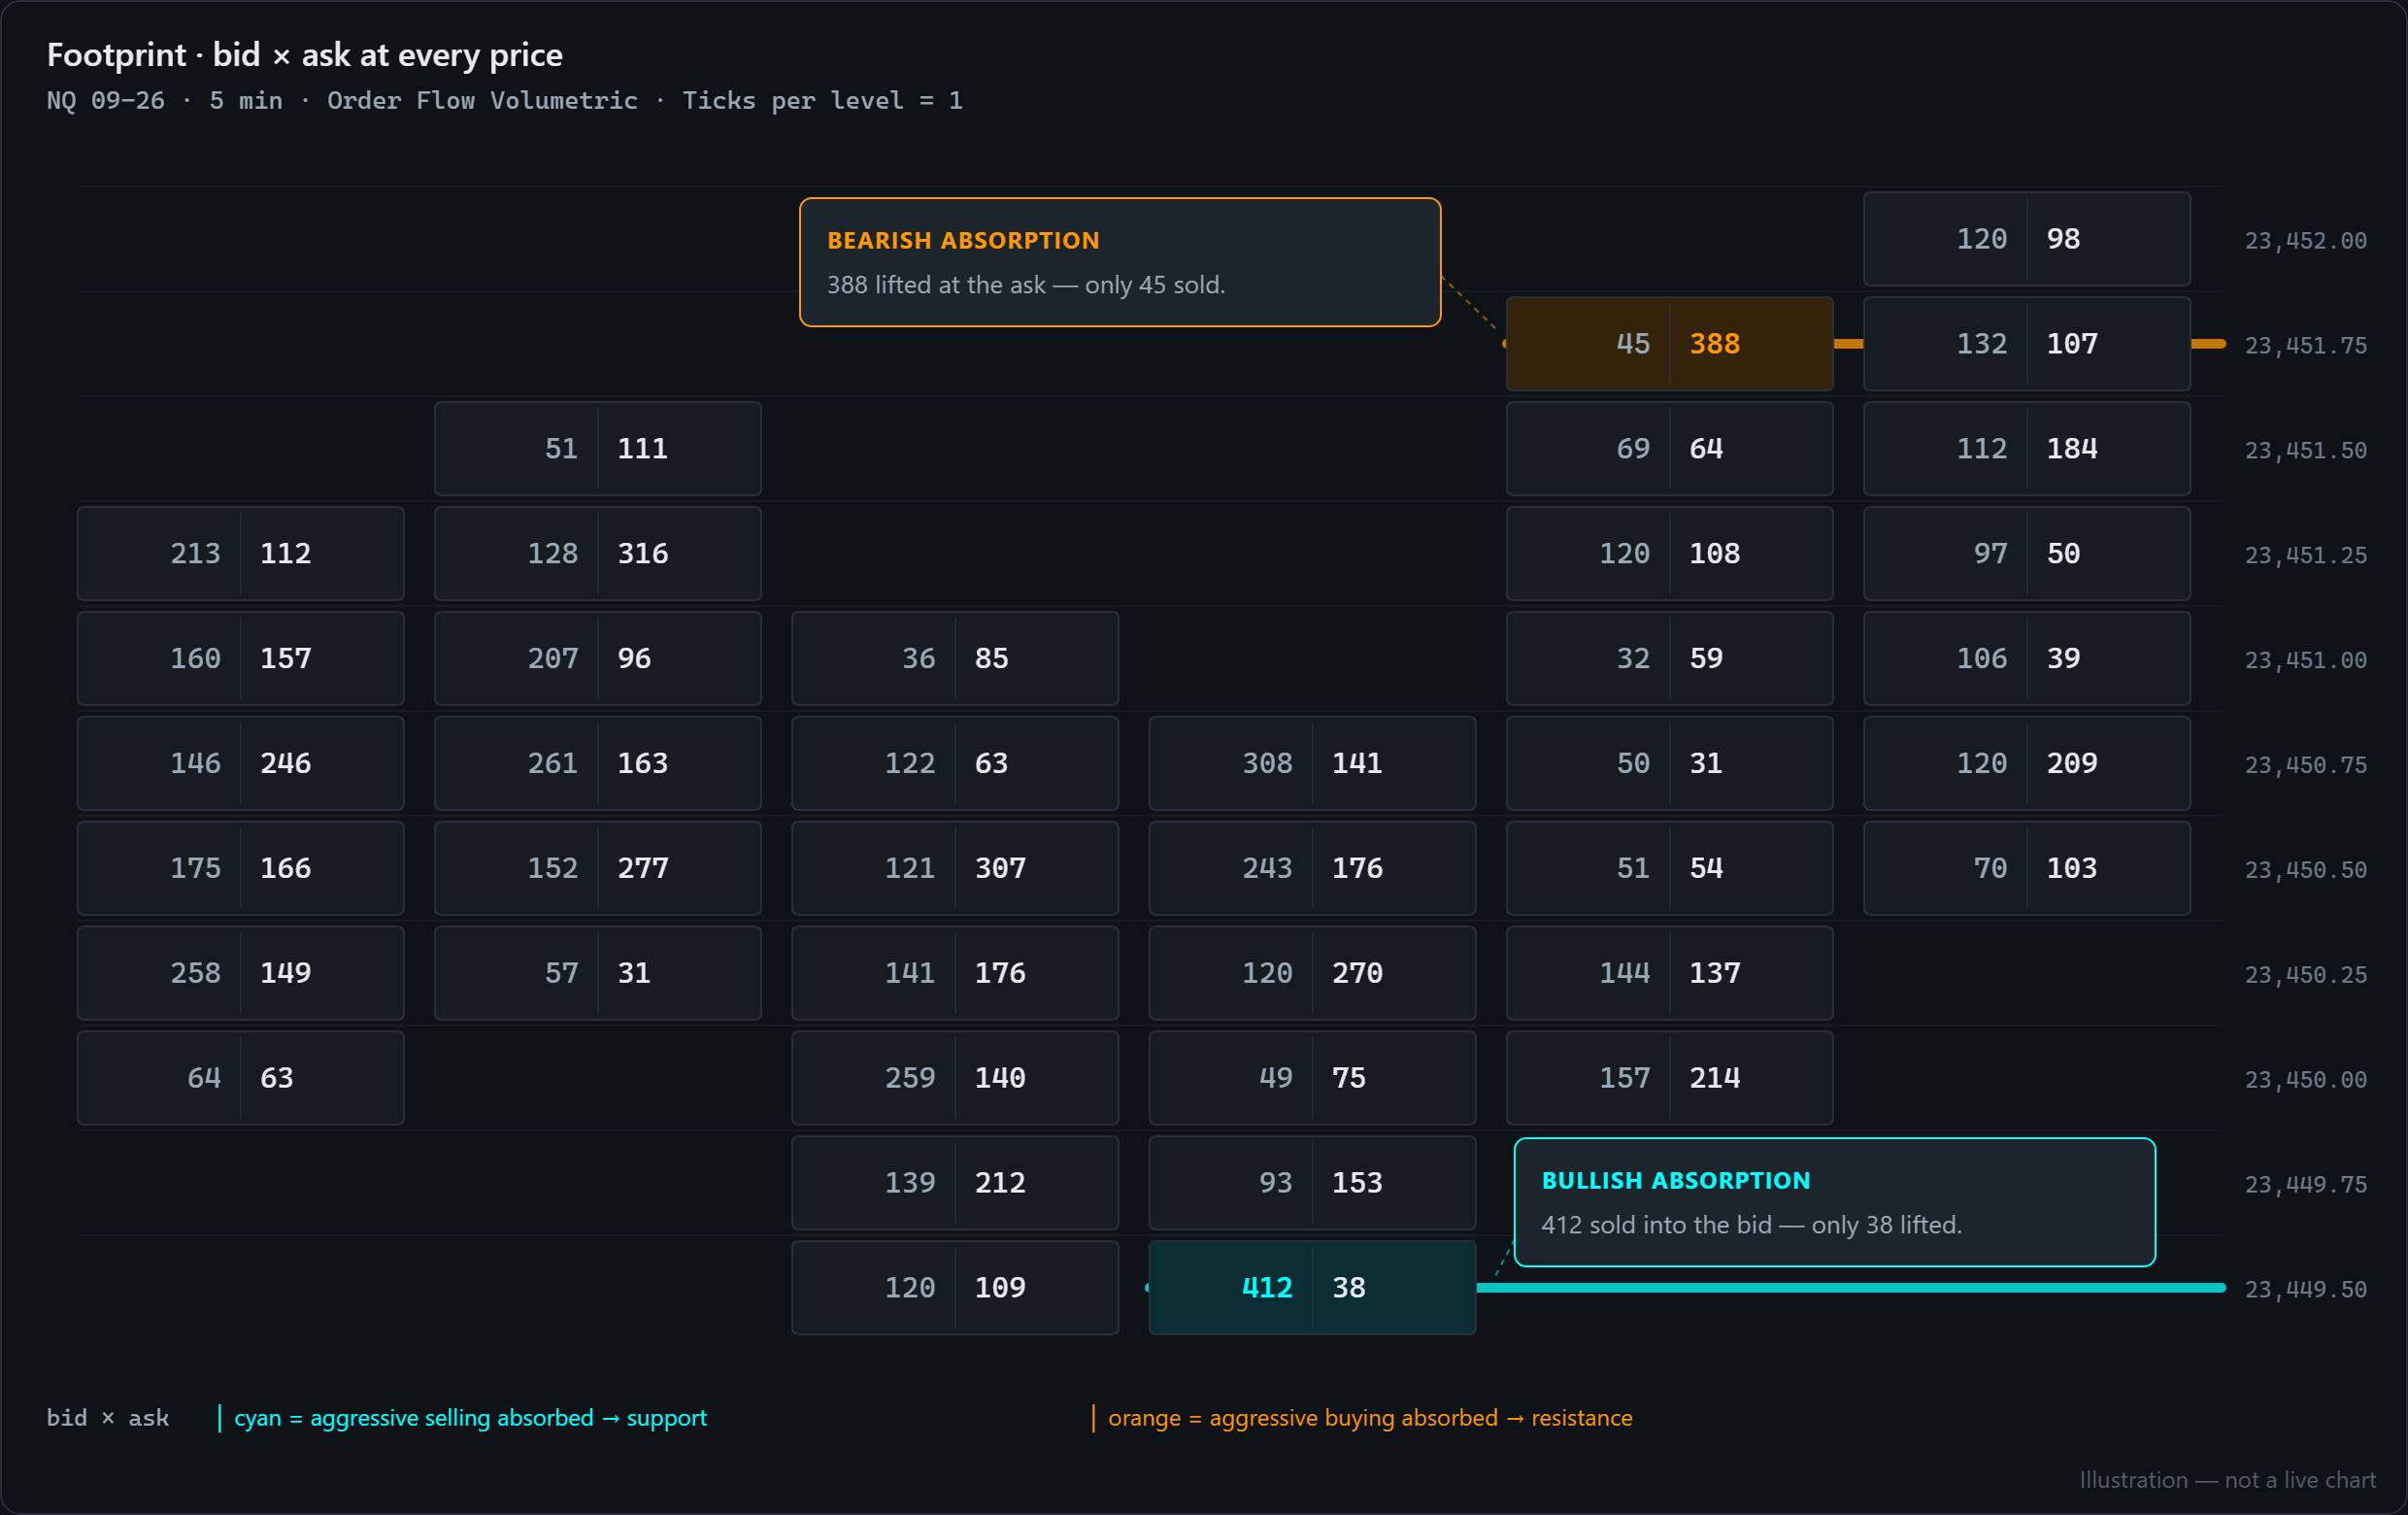
How absorption is detected
For every bar in the lookback window, the indicator walks each price level from low to high and applies four tests in order.
bid + ask ≥ Minimum volume. Cuts the noise levels before anything else runs.
bid ≥ ask × Ratio for bullish, or the reverse for bearish. At the default 300%, one side must be three times the other.
Optionally require N consecutive levels in the same direction.
Optionally require the level to sit at the bar’s high or low — classic absorption at the extreme. Fewer signals, cleaner ones.
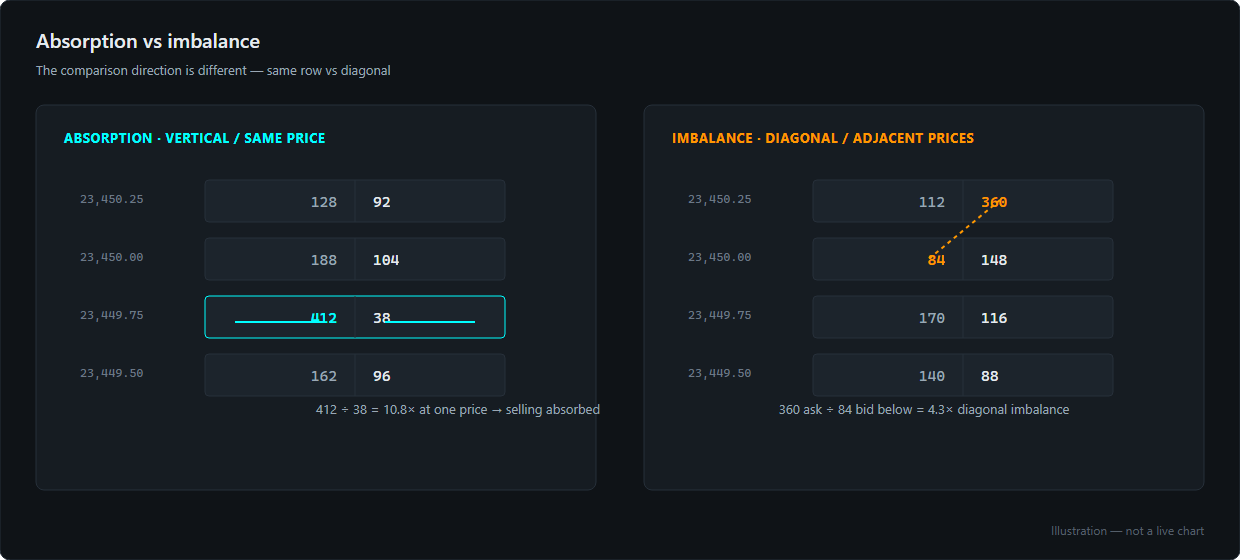
The comparison is vertical — bid against ask at the same price. That is what makes it absorption rather than an imbalance, which compares diagonally across adjacent prices. Most traders conflate the two, and the difference is the whole point: an imbalance describes a move, absorption describes a wall.
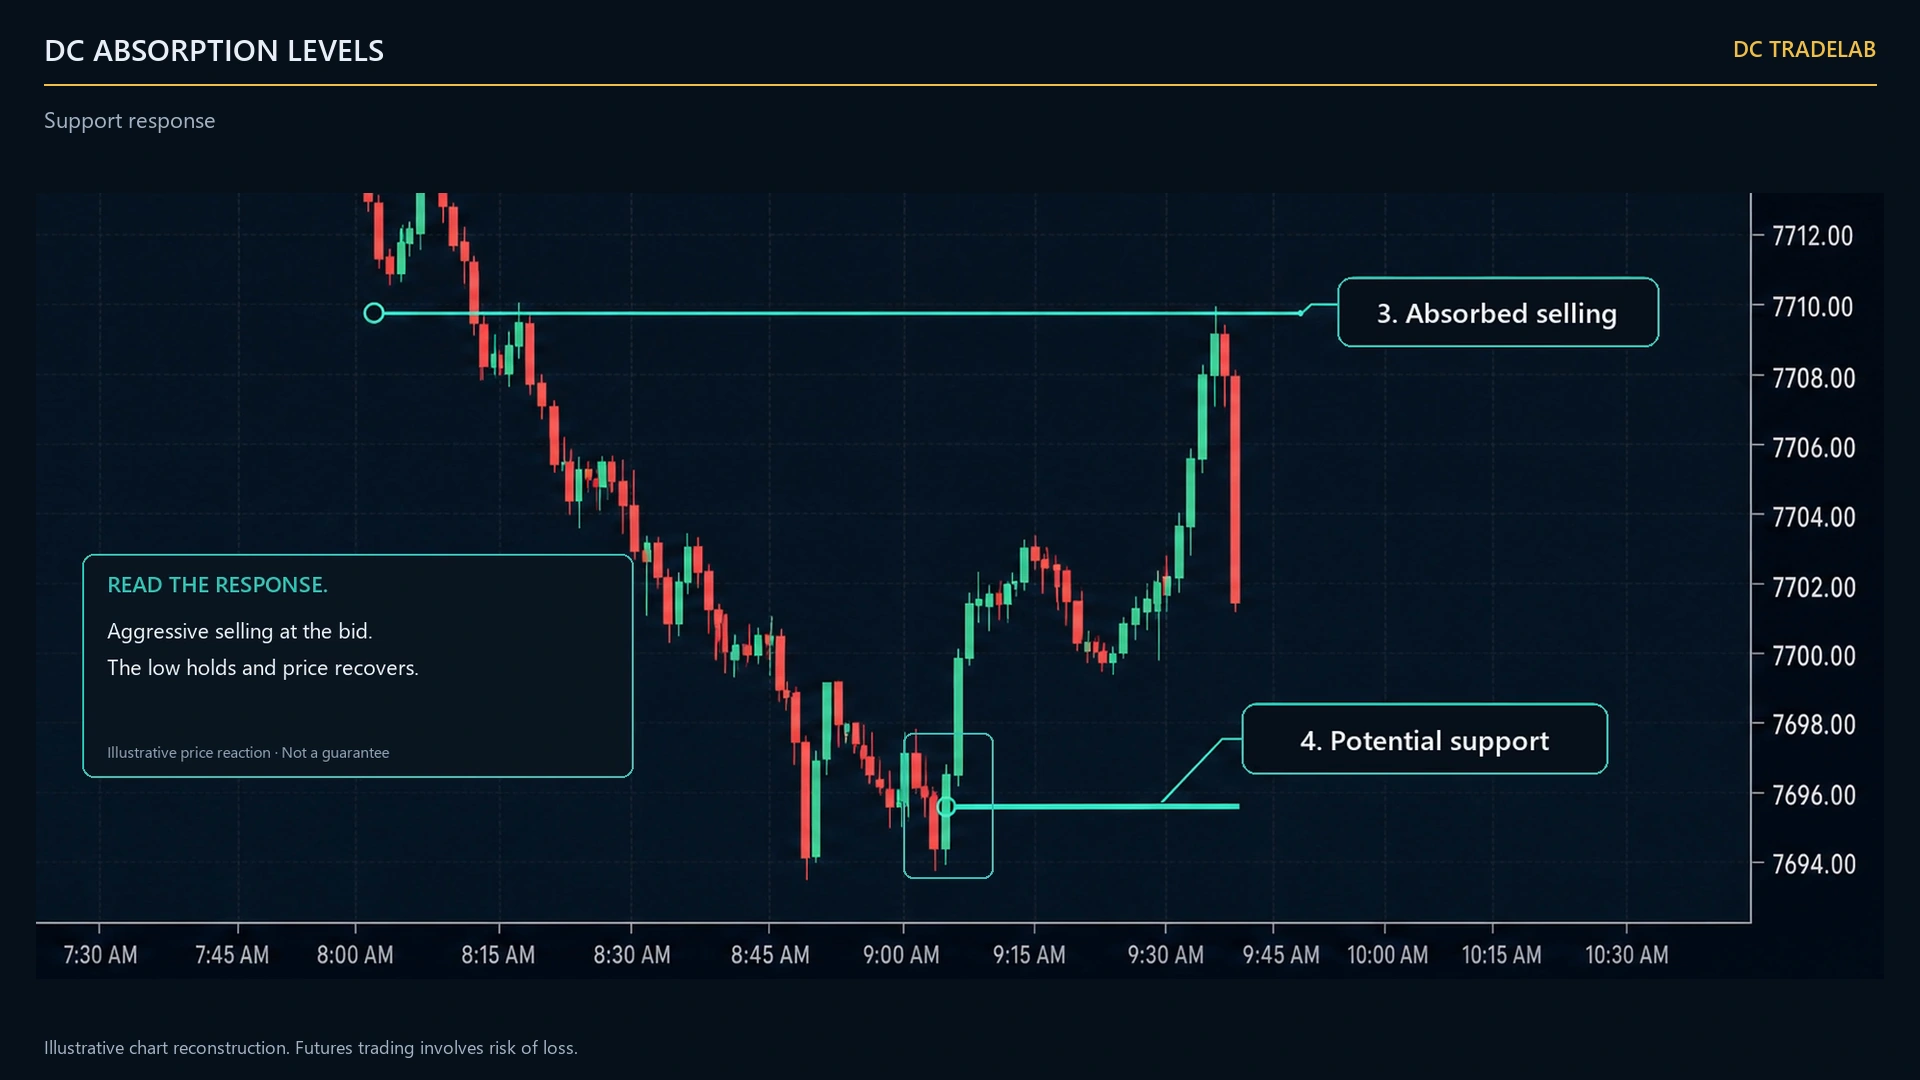
The four settings that decide what your chart looks like
There are more parameters than this, but these are the ones that matter.
| Setting | Default | What it controls |
|---|---|---|
| Ratio (%) | 300 | How dominant the absorbed side must be. 200 gives more levels, 400–500 only strongly one-sided ones. Instrument-independent. |
| Minimum volume | 10 | The noise floor. Scales per instrument — ES needs a much higher value than NQ. |
| Max levels to show | 8 | Show only the N strongest. The single best knob for a clean chart. |
| Recent bars | 100 | Only levels from the recent past. 0 shows the whole window. |
Starting points for five-minute scalping
| NQ | ES | RTY | |
|---|---|---|---|
| Ratio (%) | 300 | 300 | 300 |
| Minimum volume | 40 | 150 | 25 |
| Max levels | 8 | 8 | 8 |
Also available: ticks per level, one-level-per-bar (on by default, for a clean chart), extend-to-right or fixed length, colour inversion, and touch and approach alerts with a chosen .wav file.
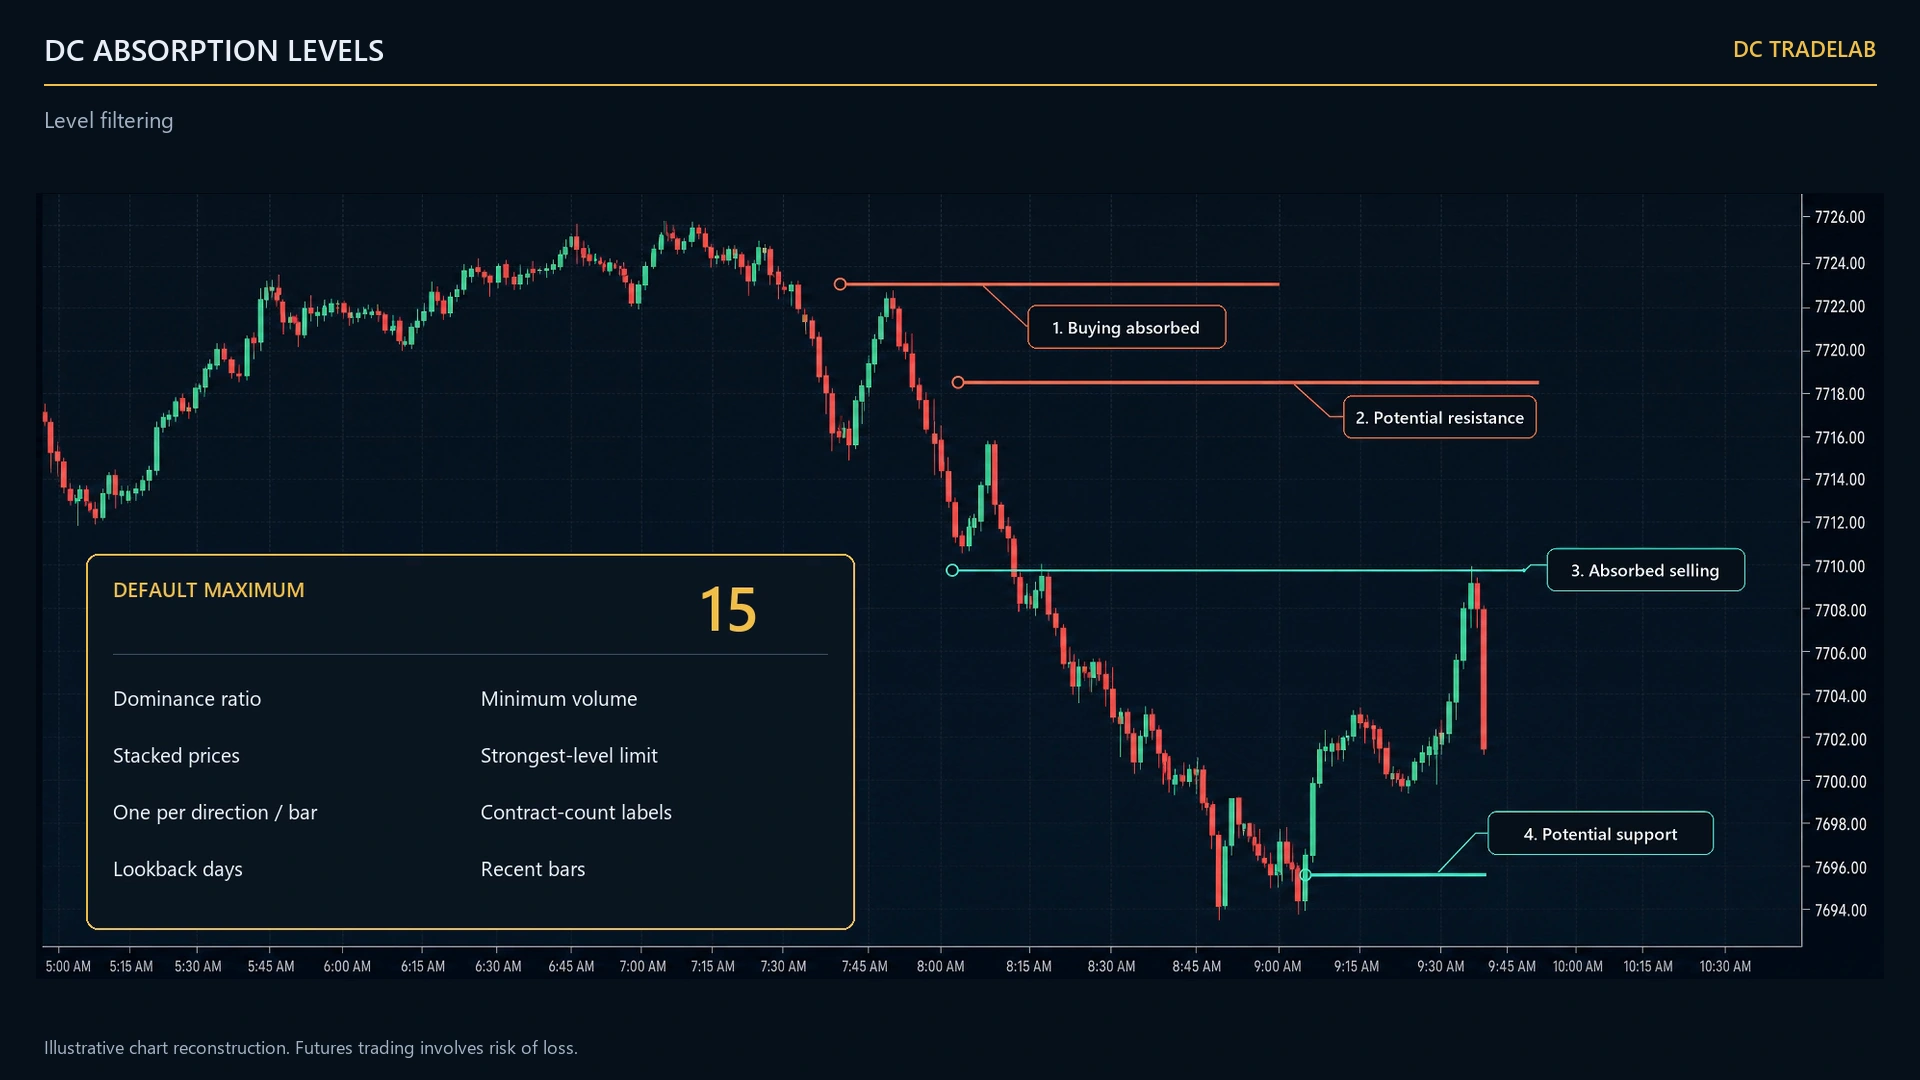
Calibrating it for your instrument
Minimum volume is the only setting that genuinely has to be re-tuned per instrument, and there is a method rather than a guess.
Turn on Show volume label so each line displays how much volume it absorbed. Set Max levels and Recent bars to 0 temporarily so you can see everything.
Scroll back and find levels where price clearly reacted. Read their volume labels, note the typical figure, and set Minimum volume just below it. The small noisy levels disappear on their own.
Recent bars to your actual trading window (80–150 bars on a five-minute chart), Max levels to six to ten. Then save a template per instrument.
A map of the levels, and the decision stays yours
What this indicator gives you is structure you can trade around: the prices where aggression met a wall, marked as they happen.
Absorption tells you where one side was absorbed and could not move price. That is an objective level, drawn by the market rather than by an opinion, and it is the kind of reference a plan can be built on: where you are wrong, where you would scale, where you would stand aside. It is not, on its own, a reason to act — which is exactly why this indicator draws the level and leaves the decision to you.
That is also why it is sold as a map, not a signal. It shows you where the levels are. Weighing which one has enough around it to be worth acting on is what DC Absorption Premium scores.
That design came out of our own logged order flow on three instruments, read with the caution historical data deserves: it is read with hindsight, it carries no execution cost, and it never once failed to fill. So this site publishes no win rate and no profit figure — we describe what the instrument draws, and you test it on your own instrument and timeframe.
Coming from ATAS?
The absorption tool many traders know from ATAS does not exist on NinjaTrader, and its source is not public. This rebuilds the same idea on NinjaTrader’s volumetric API, with the parameters mapped one to one.
| ATAS | DC Absorption Levels |
|---|---|
| Days look back | Days look back |
| Verhältnis / Ratio | Ratio (%) — 300 means three times |
| Gestapelte Ebenen | Stacked levels |
| Minimum Volume | Minimum volume |
| Bullische / Bärische Farbe | Bullish / bearish colour — cyan and orange by default |
| Alarm / Annäherungsalarm | Touch alert / approach alert |
Plus settings ATAS does not have: max levels to show, a recent-bars window, require-at-extreme, one-level-per-bar and colour inversion.
Key facts
| Platform | NinjaTrader 8, Windows |
|---|---|
| Order Flow+ required | Yes |
| Tick Replay | Required for levels on historical bars |
| Bar types | Order Flow Volumetric directly, or minute / tick / second / volume / range with a volumetric series added in the background. Renko is not supported. |
| Instruments | Any with real bid/ask volume — ES, NQ, RTY, CL, GC, 6E |
| Price | $299 one-time, lifetime updates, 3 machines |
Frequently asked questions
Why do I see no lines at all?
Usually the ratio or minimum volume is set too high for the instrument. Drop Ratio to 200 and Minimum volume to 5 to confirm the data is flowing, then tune upward from there.
Why are there no lines on historical bars?
Tick Replay is off, or the chart has not been reloaded since it was switched on. Enable it in Tools, Options, Market Data, set it to True in the chart’s Data Series, then Reload All Historical Data.
Does it work on Renko?
No. Renko discards the time and volume structure the calculation needs. Use minute, tick, second, volume, range or volumetric bars.
Is this the same as a stacked imbalance indicator?
Related but different. An imbalance compares bid and ask diagonally, across adjacent prices. Absorption compares them vertically, at the same price. This indicator can require stacked levels, but the underlying test is the absorption one.
How much volume counts as absorption?
It depends entirely on the instrument. On NQ a level absorbing 150 to 400 contracts is meaningful; on ES the equivalent figure is much higher. Calibrate against levels where price visibly reacted, using the method above.
Can absorption fail?
Constantly. A passive buyer can be overwhelmed, and when a level that absorbed heavily breaks, the move through it is often fast because the defender is now trapped. That is why the stop belongs on the other side of the level, not at it.
Lock the founder price
All ten indicators, the copier and the Telegram agent, lifetime, at $1,845 for the first fifty. No payment taken today.