$249 lifetime
Big trade indicator for NinjaTrader 8
In short: DC Big Trade marks large executions on your chart at the price they actually happened, with the contract count inside the shape and the aggressor in the colour. It detects two different events — blocks and sweeps — because size shows up in two different ways, and a filter that only looks for one of them misses a third to a half of what matters.
Two different events, two different shapes
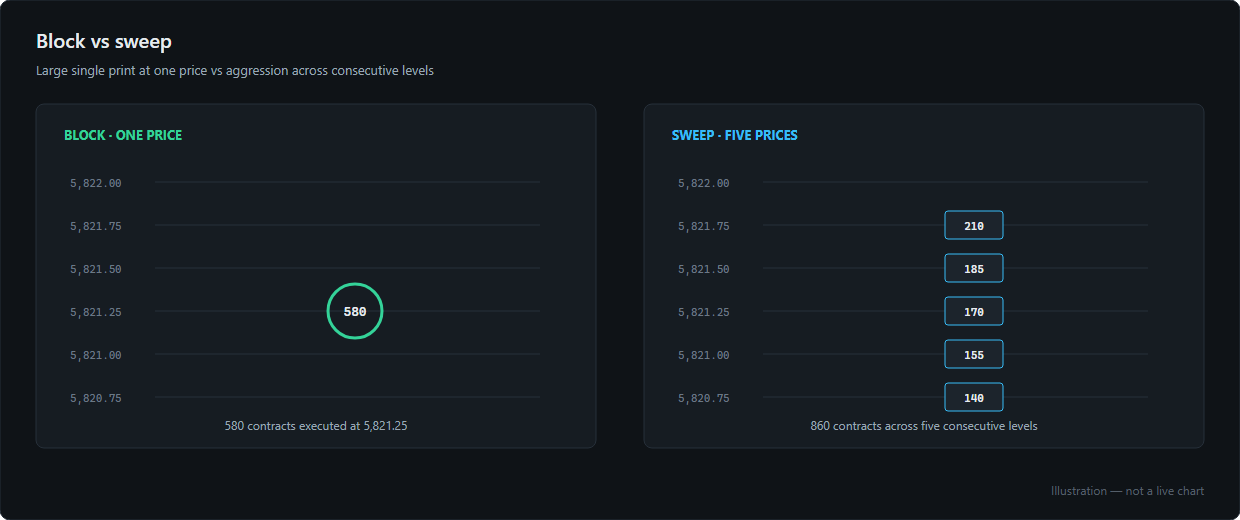
Block — a circle
One large print filling at one or two price levels. Somebody is standing there filling everything that comes, which is absorption. Typical on ES, where the book is deep enough that a large participant can fill significant size at a single price.
Sweep — a square
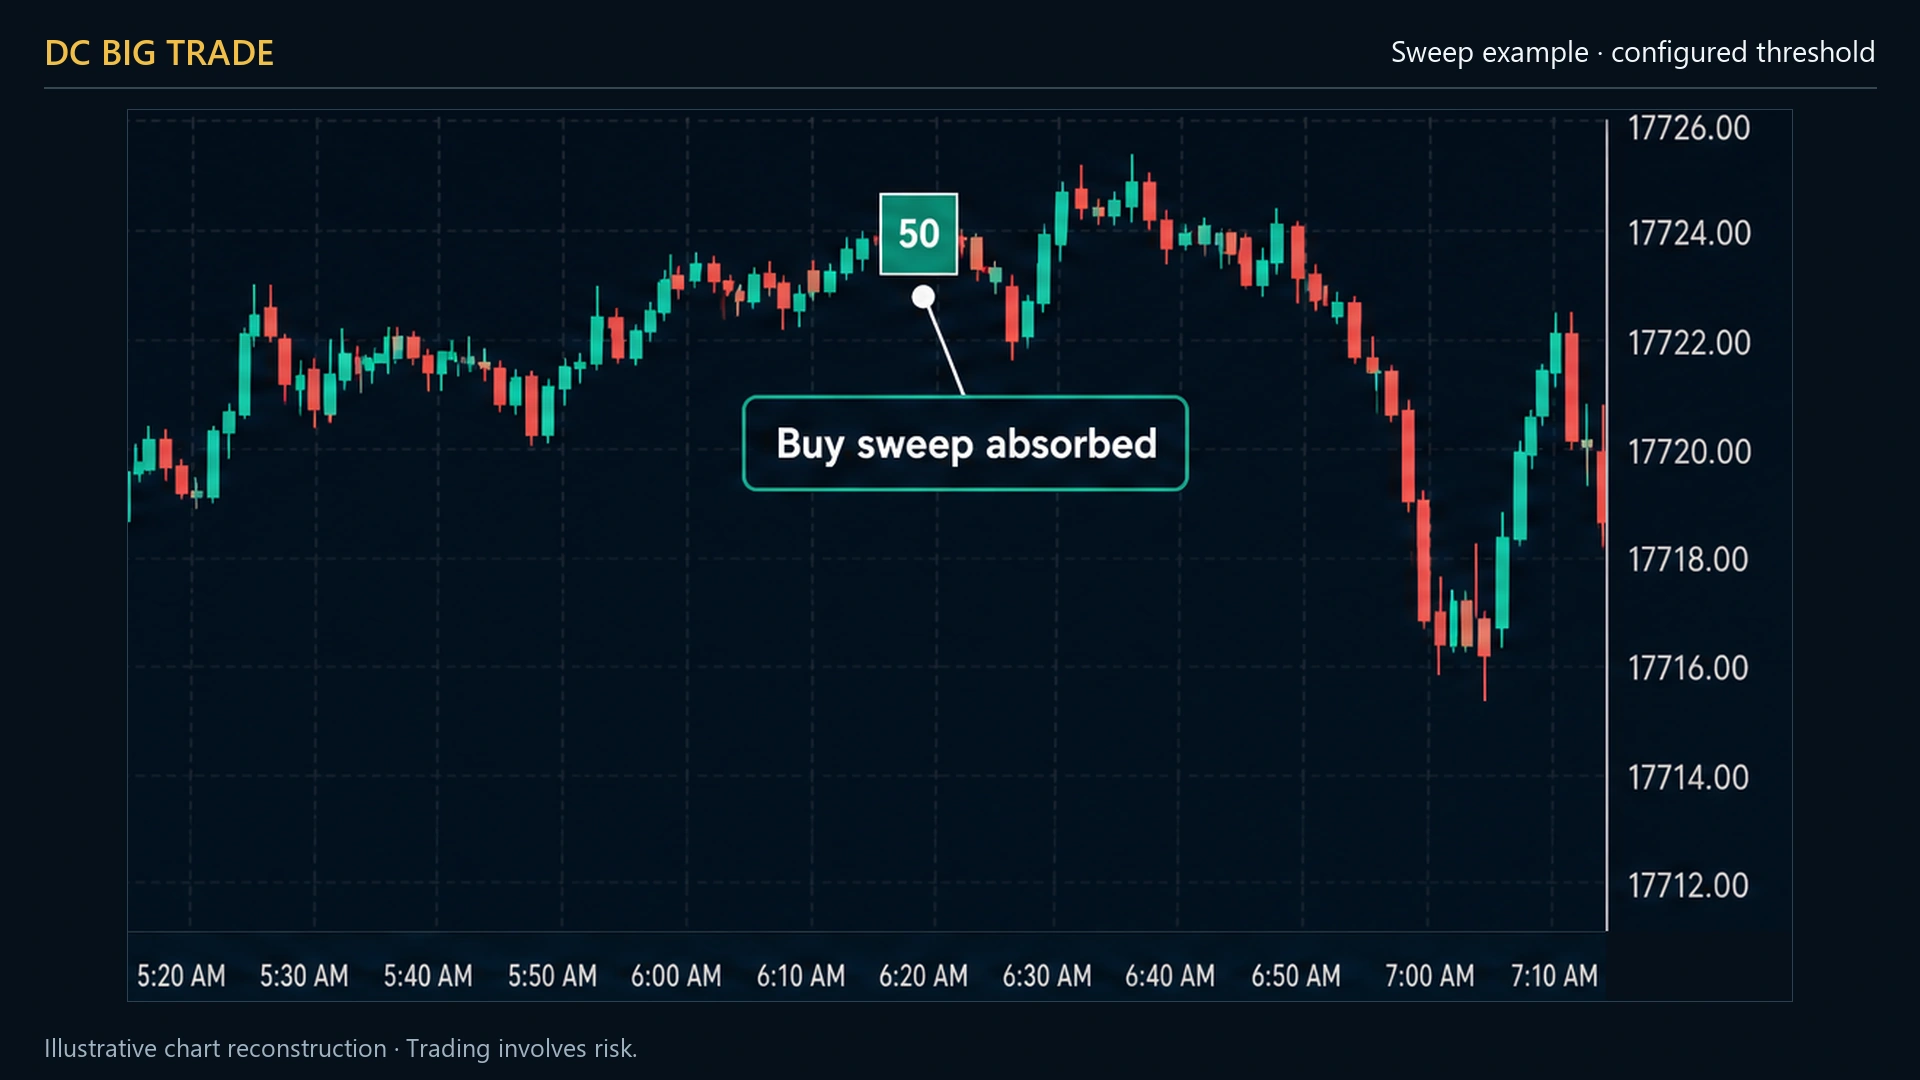
Large volume ripped across many price levels within milliseconds. Somebody is tearing through the book to get filled, which is aggression. Typical on NQ, where the book is thin enough that the same participant has to eat five or more levels.
They mean opposite things. One is a wall, the other is a battering ram. Drawing them with the same marker would be throwing away the only piece of information that matters.
Why one filter is not enough
This is the measurement that produced the design, and it is the reason the indicator has two engines instead of one setting.
On a real log of roughly 31,000 clusters across ES, NQ and RTY, a filter that looks only at individual print size misses 30 to 50% of the largest market events.
The reason is structural rather than statistical. ES has a deep book, so a large participant fills big size at one price and the print itself is large — blocks dominate. NQ has a thin book, so the same participant has to eat five or more levels and no single print is remarkable — sweeps dominate.
Set a size threshold high enough to be meaningful on ES and you will see almost nothing on NQ. Set it low enough for NQ and ES becomes unreadable. There is no single number that works on both, which is why there are two detectors with independent thresholds.
Reading the marks
Shape
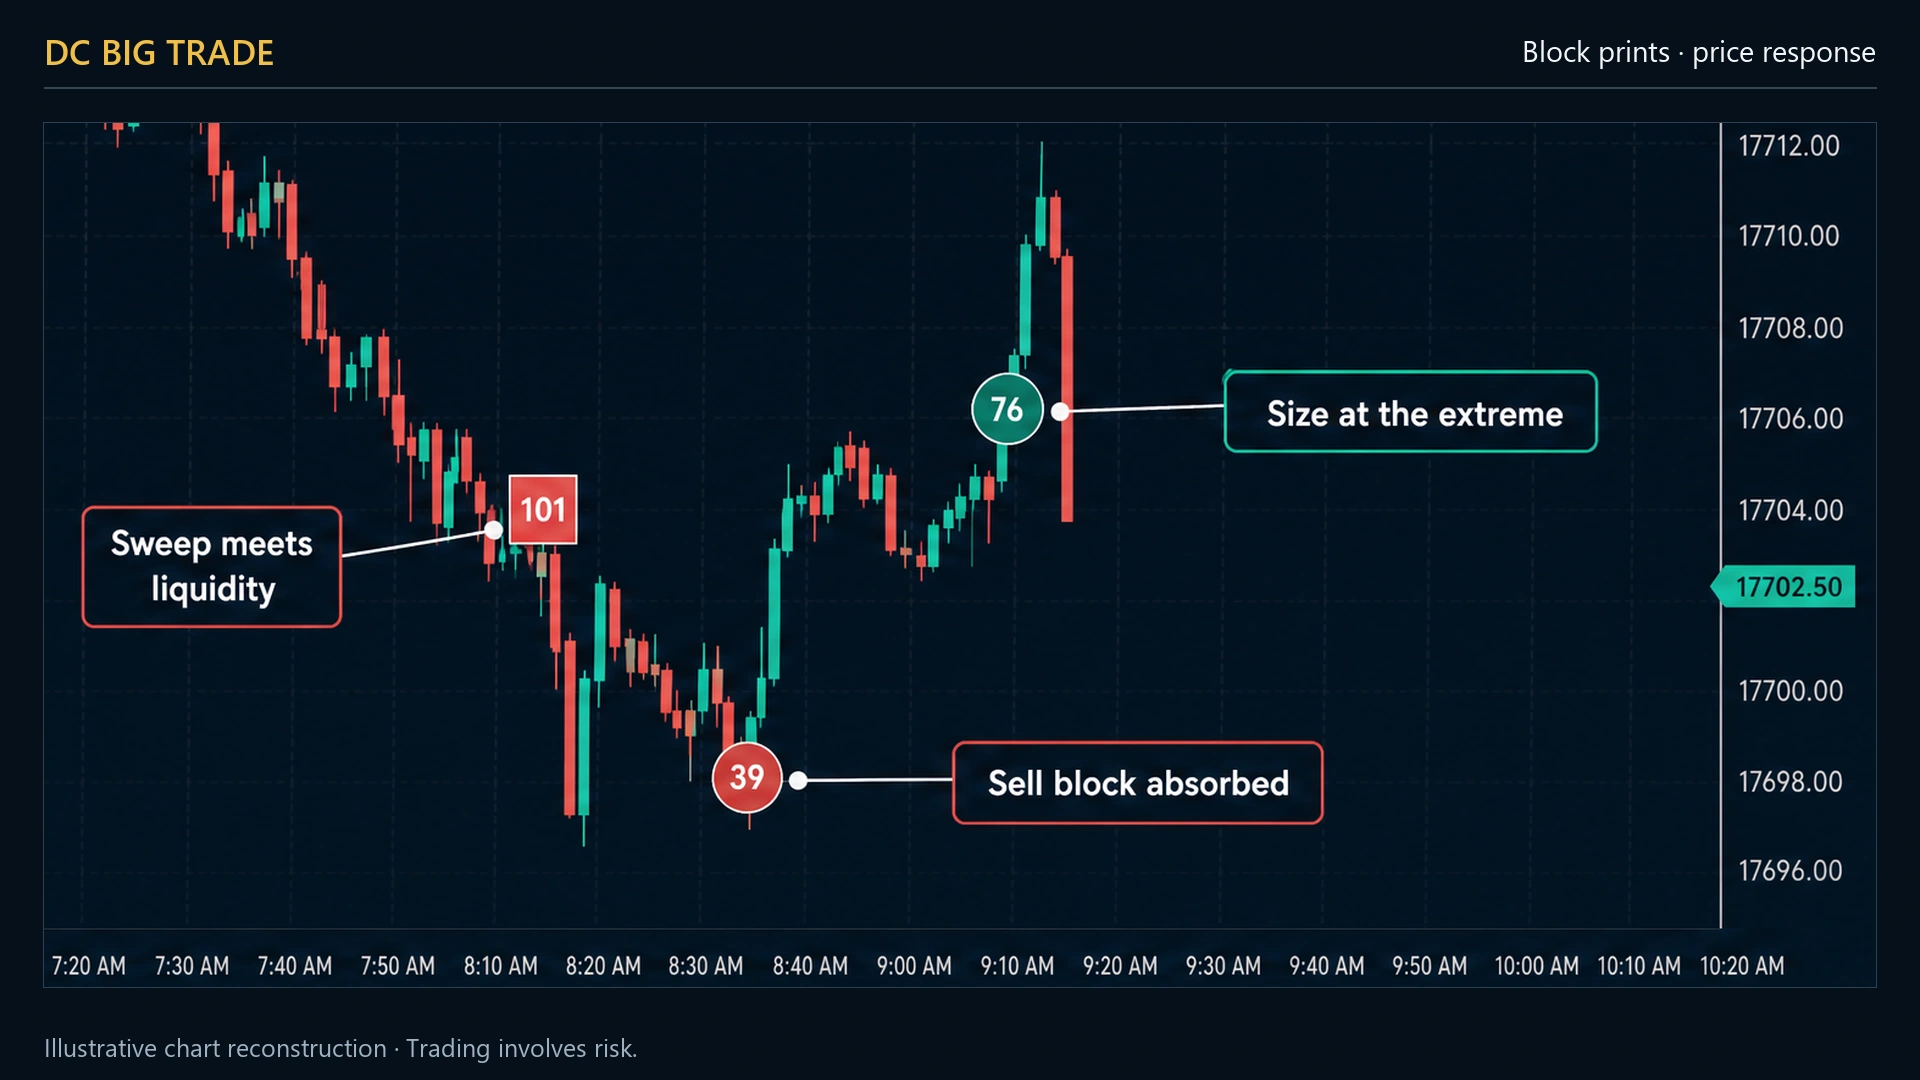
Circle for a block, square for a sweep.
Number
Total contracts in that event, written inside the shape.
Colour
The aggressor. Green if the buyer lifted the ask, red if the seller hit the bid.
Position
At the exact execution price — not at the bar’s close, which is where most tools put it.
The combination is what carries meaning. A large red sweep into a level that then holds says something completely different from a large red block sitting at the same price. The first is aggression that failed; the second is somebody quietly filling.
Thresholds that know what time it is
What counts as “big” at 03:00 is not what counts as big at 09:30. Thresholds switch automatically between the EU and US sessions, and both sets are editable from a panel you open with the BigTrade button on the chart toolbar.
Why filtering happens at render time
Every cluster above a low collection threshold is stored unfiltered. The block, sweep and session filters are applied when the chart draws.
That means you can drag a threshold and watch marks appear and disappear instantly on historical bars, instead of guessing, saving, reloading and guessing again. Calibration takes minutes rather than an afternoon — and calibration is the whole game with this kind of tool.
Starting thresholds
| NQ | ES | RTY | |
|---|---|---|---|
| Block minimum size | 15 | 75 | 8 |
| Sweep minimum total | 40 | 150 | 25 |
| Sweep levels | 4+ | 3+ | 4+ |
Start here, then use the live panel: raise the threshold until only the events that visibly mattered are still marked.
Key facts
| Platform | NinjaTrader 8, Windows |
|---|---|
| Order Flow+ required | Yes |
| Tick Replay | Required for historical marks. Real time works without it, from the moment you load the indicator. |
| Detection | Two independent engines — block (single print) and sweep (multi-level cluster) |
| Timeframes | Any. Detection happens at tick level; marks are placed on whatever bars you draw. |
| Tuning | Live panel from the chart toolbar, session-aware thresholds |
| Price | $249 one-time, lifetime updates, 3 machines |
The per-candle POC line is a separate indicator — DC POC Candle, free.
Separate product, or the layer inside the footprint?
Both exist, deliberately, and the difference is worth stating plainly rather than leaving you to work out.
| DC Big Trade | Inside DC OrderFlow Chart | |
|---|---|---|
| Runs on | Any chart, plain candles included | The footprint chart |
| Session-aware thresholds | Yes, EU and US switch automatically | Single threshold set |
| Live tuning panel | Yes, from the chart toolbar | In the indicator settings |
| Best for | Seeing size without a footprint on the chart | Already running the footprint |
If you run the footprint, you do not need this as well. If you want to see where size traded without turning your chart into a grid of numbers, this is the one.
Frequently asked questions
Is this an iceberg detector?
Not in the strict sense. It detects the footprint of large execution in the time and sales — blocks and sweeps. It does not read DOM refills, so it will not label a hidden order as an iceberg. What it does is show you where large size actually traded, which is the part that leaves a mark on price.
How is a sweep different from just a big bar?
A big bar is a lot of volume over a whole bar’s duration. A sweep is a lot of volume across many prices inside a window of milliseconds. One is activity; the other is a single decision.
Does it work on ES and NQ with the same settings?
No, and that is the point. ES has a deep book and NQ has a thin one, so a threshold tuned on one is meaningless on the other. Save a template per instrument — starting numbers are in the table above.
Does it work on any timeframe?
Yes. Detection happens at tick level, and the marks are placed on whatever bars you are drawing.
Why do marks not appear on older bars?
Tick Replay is off. In real time the indicator works from the moment it loads, but historical prints have to be replayed from the tick stream.
Can I buy it today?
Not yet. Checkout opens once the licensing client and payment provider are finished. The founding list locks a lower price until then.
Lock the founder price
All ten indicators, the copier and the Telegram agent, lifetime, at $1,845 for the first fifty. No payment taken today.