$399 lifetime · no Order Flow+, no Tick Replay
Key levels indicator for NinjaTrader 8
In short: DC Key Levels draws every level from closed sessions that traders actually watch, scores them by how hard price reacted, and adds three things a levels indicator normally does not have — gamma walls from the options market, an expected-move band, and an automatic plan of the day. It needs neither Order Flow+ nor Tick Replay, so it runs on a plain NinjaTrader installation.
The scoring engine is the difference
Every levels indicator draws lines. This one tracks how price actually reacted at each level — touches, rejections and breaks — and measures how hard it rejected, in points, not merely how often.
Two rejections are not equal. One that ran 26 points in half an hour and one that ran 3 points mean completely different things, and scoring them the same is why most levels indicators end up drawing noise. Levels also carry a cooldown, so a single choppy stretch cannot inflate a score by touching the same price nine times in five minutes.
The result is that the chart shows what has earned attention rather than everything that could be drawn.
What it draws
| Level | Colour | Naked | Tested |
|---|---|---|---|
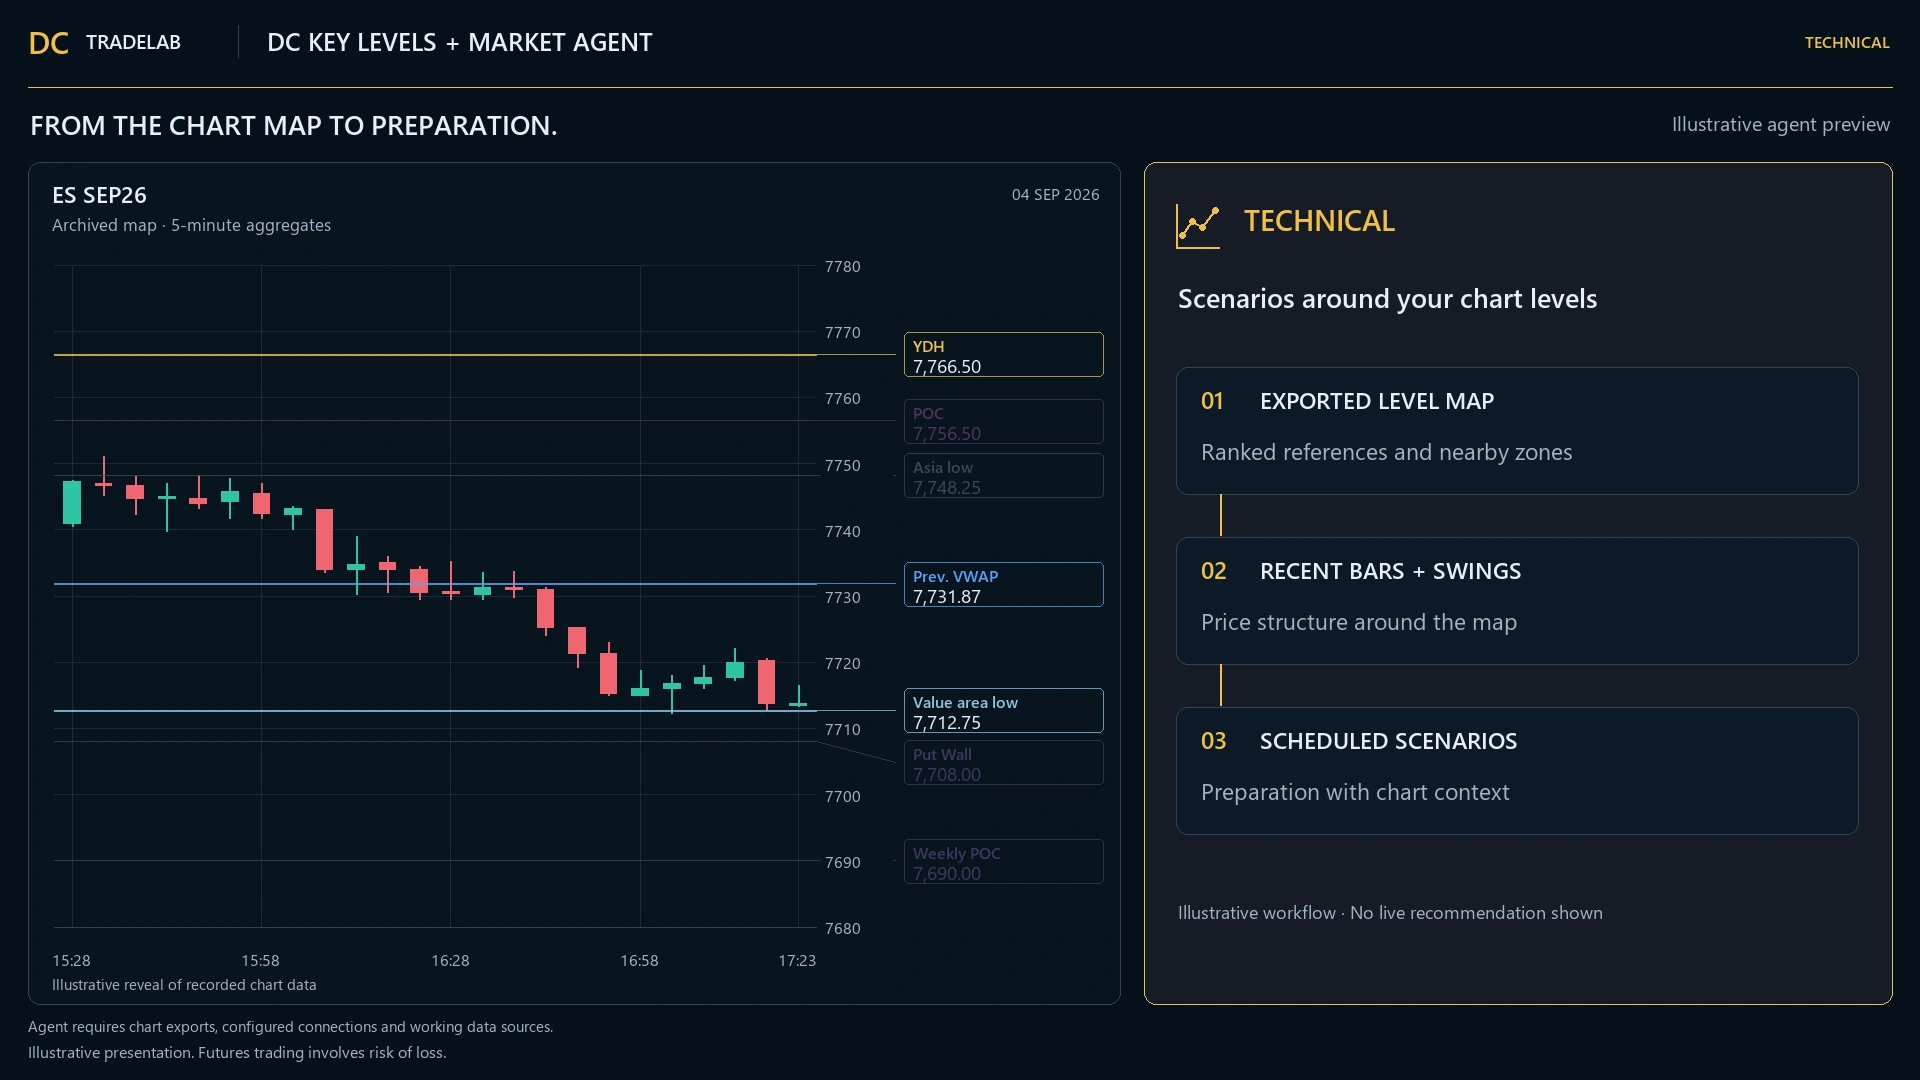
| Daily high / low, last N days | Orange | Solid | Dashed |
| Session POC, last N days | Magenta | D-1 always; older days only if still naked | |
| Value area high / low | Light blue | D-1 always; older days only if still naked | |
| Weekly high / low, prior week | Red | Solid | Dashed |
| Prior day’s VWAP close | DodgerBlue | Solid | — |
| Asia session high / low, today | Grey | Dashed | — |
| Weekly POC and untested weekly extremes | Magenta / red | Kept only while untested | |
For older days it keeps only POC and value-area levels that are still naked — a POC from four days ago that price has already traded through is clutter, not information.
Gamma levels: Call Wall, Put Wall and the flip
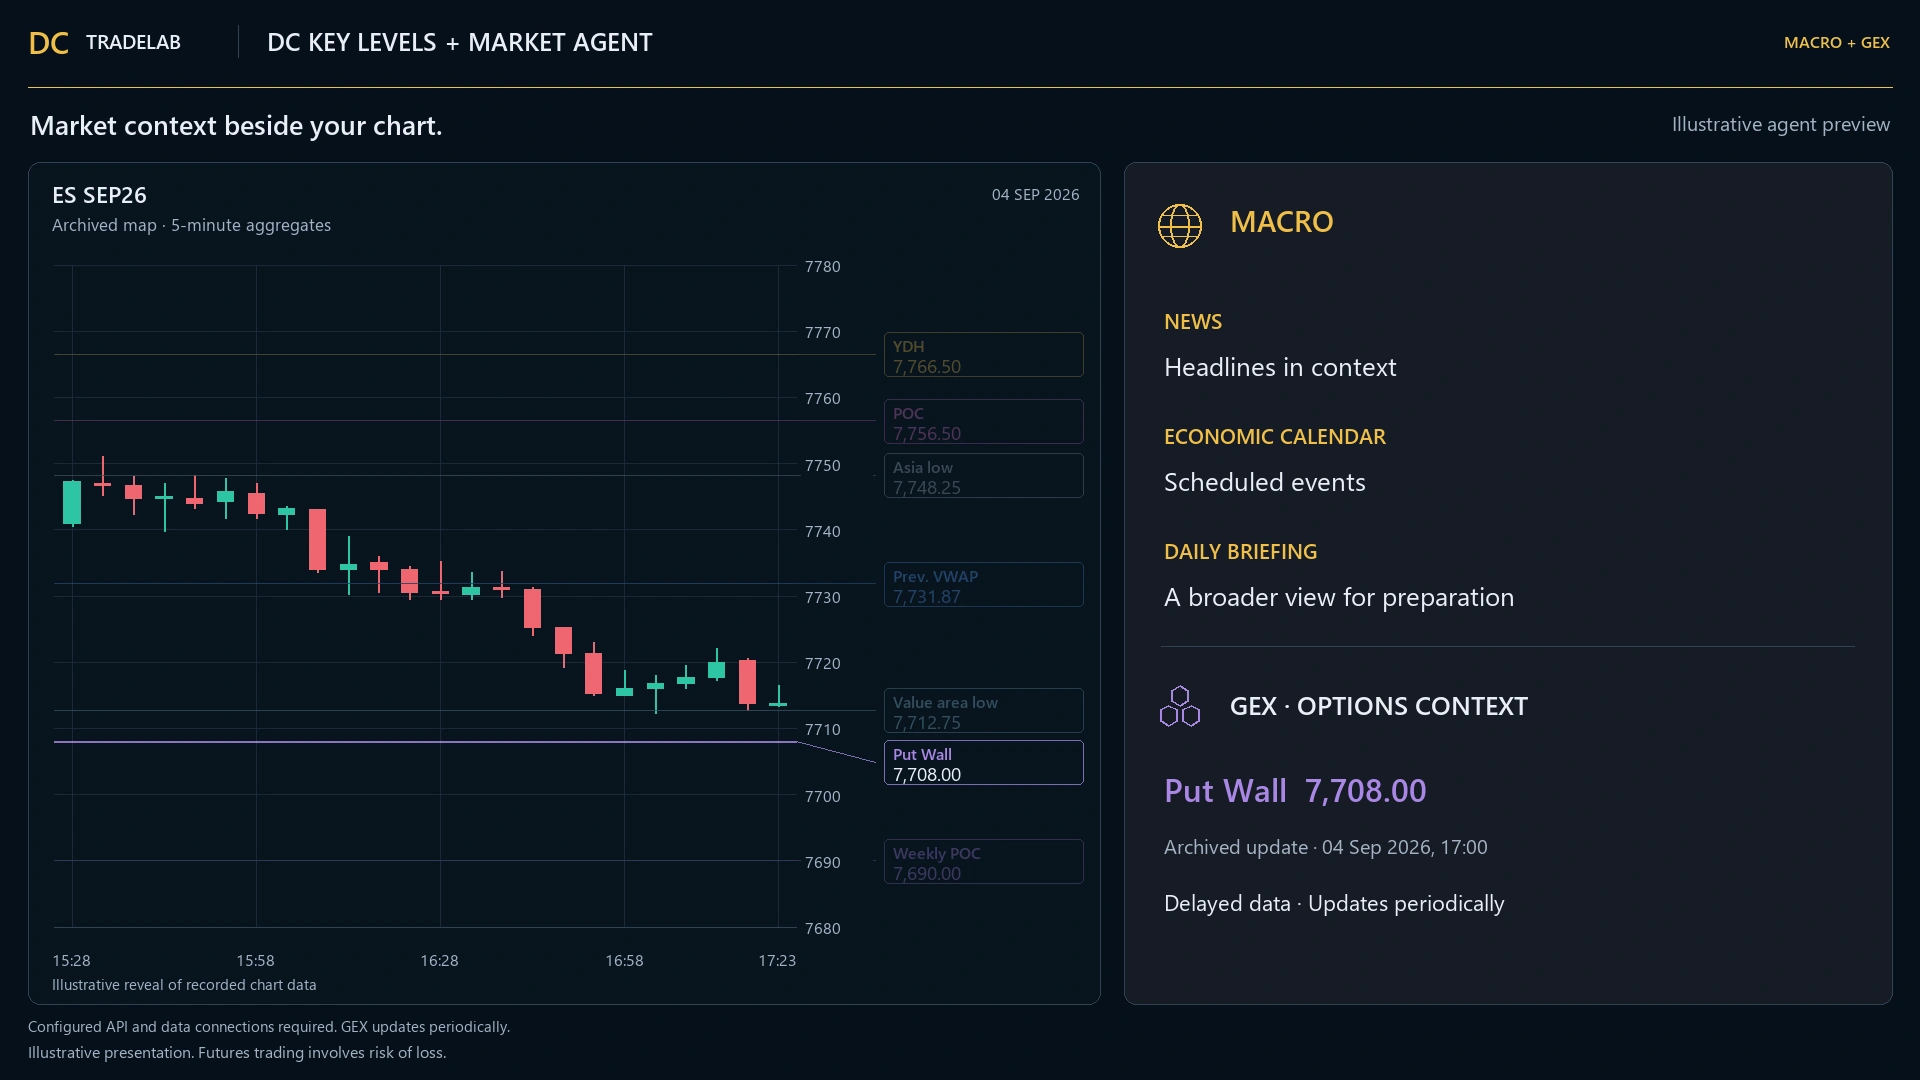
Options positioning creates prices where dealer hedging changes behaviour. The call wall and put wall tend to act as magnets and barriers; the gamma flip is where dealer hedging switches from dampening moves to amplifying them.
Almost nothing in the NinjaTrader indicator market exposes gamma structure at this price point, which is why it is the first thing named on this page rather than a bullet near the bottom. A GEX touch journal writes every interaction with those levels to CSV, with a cooldown, so you can review which ones actually held rather than remembering selectively.
An honest dependency. The indicator can also pull MenthorQ levels as a second opinion, including 0DTE strikes. MenthorQ is a paid third-party data subscription and is not included — the feature works without it, but if you want that second source you will be paying somebody else for it. Better said here than discovered after purchase.
The plan of the day
At a fixed hour — one for the EU session, one for the US session — the indicator freezes a plan: a ranked list of upside and downside scenarios, stepping outward from price, each annotated as inside or outside the expected move.
The number of steps per direction and the minimum gap between them (sized in ATR, so it adapts to the day’s volatility) are both settings. It freezes deliberately: a plan that keeps rewriting itself as price moves is not a plan, it is a running commentary.
When the structure does not support a directional read, it says so rather than inventing one. That is the behaviour you want from something you are going to trust before the open.
Expected move band
EM+ and EM− drawn as lines, so every scenario can be read as inside or outside the move the market is pricing.
Route map
Boxes and arrows projecting the likely paths a configurable number of bars forward.
On-chart panel
Bias and ROOM, a countdown to the next news event, and target and stop distances.
Confluence merging
When several levels land within a few ticks of each other they are drawn as one thicker, highlighted line with a combined label — DH1+VAL1, or POC1+VWAPc — naming the most important component first.
Priority order: Daily › Weekly › POC › VWAP close › Value area › Asia. The merge threshold is four ticks by default, and zero disables it.
This is the part that makes the chart usable rather than crowded. A genuine confluence zone looks more important, instead of looking like three lines you have to interpret at speed.
Proven swings, not every wiggle
Swing pivots have to survive a real rejection test before they are drawn: a minimum number of rejections, each of a minimum strength measured in ATR, inside a measurement window. You can restrict them to today’s session only.
Light on your chart, exact on every timeframe
The heavy work — building a volume profile to find the POC and value area — is done once per day from a background one-minute series, not from your chart’s bars.
Two consequences. The levels are identical on every timeframe, so your one-minute execution chart and your fifteen-minute context chart show the same prices, with no discrepancies to reconcile in your head. And the calculation costs almost nothing at runtime, because the expensive part happened at session close.
Old levels are archived to disk and refilled automatically, so untested extremes survive a restart instead of quietly disappearing.
One setup requirement: the chart’s Days to load must be five or more, otherwise the closed sessions it needs are simply not in the data.
Key facts
| Platform | NinjaTrader 8, Windows |
|---|---|
| Order Flow+ required | No |
| Tick Replay required | No |
| Chart types | Any |
| Needs | Days to load ≥ 5 in the chart’s Data Series |
| Setting groups | Levels · Display · Relevance · Swing pivots · Support/resistance zones · Agent |
| Defaults | 3 days back, confluence 4 ticks, Asia window 01:00–08:00 chart time |
| Third-party data | MenthorQ levels optional, paid separately |
| Price | $399 one-time, lifetime updates, 3 machines |
This is the widest-audience product in the catalogue: it works on a free NinjaTrader licence with no order flow data at all.
Frequently asked questions
Do I really not need Order Flow+ or Tick Replay?
Correct. The volume profile behind the POC and value area is built from a background one-minute series rather than from tick data, so a standard NinjaTrader data connection is enough. It is the only tool here that runs on a completely plain installation.
What is a naked level?
A level price has never traded back through since it formed. They are drawn solid; already-tested levels are dashed. Untested levels tend to attract price, which is why the distinction is worth having without needing to remember it.
Do I need a MenthorQ subscription?
No. MenthorQ levels are an optional second opinion. The gamma levels the indicator calculates itself work without any third-party subscription. If you already pay for MenthorQ you can bring those levels in; if not, nothing is missing from the core.
Why are some levels missing?
The chart’s Days to load is probably too low. Set it to at least five in Data Series so the closed sessions exist in the data.
Will the levels match on my other charts?
Yes, exactly. Because they are computed from a background one-minute series rather than from the chart’s own bars, the same instrument gives the same prices on every timeframe. Configure once, then right-click the indicator and choose Set as default.
Does it work with the absorption indicators?
That is the intended combination. Key Levels gives the structure that existed before today started; the absorption tools show where today’s flow is being eaten. A fresh absorption level sitting exactly on a naked POC is a very different proposition from one floating in the middle of nowhere.
Lock the founder price
Key Levels alone is planned at $399. The founding bundle — all ten indicators, the copier and the Telegram agent, lifetime — is $1,845 for the first fifty. No payment taken today.