$459 lifetime
Effort vs result for NinjaTrader 8
In short: DC Effort measures the balance between effort — volume and delta — and result — how far price actually went — on every closed bar, scores four independent order-flow forces from the footprint, and draws a rectangle on the price zone where one side took control and held it.
Requires NinjaTrader 8 and Order Flow+ (included in a Lifetime licence). Tick Replay is not required. Windows.
The problem
It is 09:47. You are two minutes into the session on NQ, one contract of your allowance already spent on a trade you should not have taken, and the footprint in front of you is doing what a footprint does.
Forty visible bars. Each one twenty-odd price levels deep. Each level two numbers. That is roughly sixteen hundred numbers on screen, refreshing, and every one of them is true.
Price stalls. A bar prints heavy volume and a fat negative delta and closes near its high — sellers hit it hard and got nothing back. Two bars later the same thing happens four ticks lower. You half notice. Three bars after that, price is back at the first level and something is holding it again, and now you are guessing whether that is the same participant defending a price or three unrelated coincidences that you are pattern-matching because you want the long.
The information you needed was on the screen the whole time. What was missing was the arithmetic: was this the same price, in the same direction, defended more than once, recently enough to still mean something? That is a counting problem, and counting is not what a human eye does well at 09:47 with money on.
DC Effort does the counting. It does not tell you what to do. It tells you what happened, so your decision has something to stand on.
How it works
At the close of every bar, four independent forces are computed from that bar’s footprint. Each returns a number between −1 (sellers in control) and +1 (buyers in control).
Bar delta as a share of bar volume, scaled by volume against the recent average, then multiplied by whether price actually followed the aggressors. Effort with no result does not count as aggression — it is handed to force 2.
Large delta on one side, volume above average, range compressed against average, and the bar closing against the aggressors. Scores for the passive side: the limit orders that ate the aggression.
Diagonal footprint imbalances — ask at a price against bid one level below, bid against ask one level above — with a bonus for consecutive runs.
Ticks travelled per contract traded, against that instrument’s recent average. Cheap movement means a thin book in that direction. Gated by a real move, so drift does not score.
Two decisions inside the arithmetic that a sceptic should check first.
The imbalance floor is adaptive. A level only counts if it clears the larger of an absolute contract count and a percentage of that bar’s volume — so the measurement behaves the same on a 25-contract bar as on a 2,000-contract bar, without you re-tuning it per session.
On an absorption bar the imbalances are turned around. They belong to the side that was absorbed, so they mark the wall, not the direction. Without that flip, force 3 contradicts force 2 on precisely the bars where absorption matters.
The score divides by the active forces, not by four. One decisive force on its own would otherwise be diluted to 0.25 and could never register. Instead there is a coverage penalty: two forces are worth less than four, but not half as much.
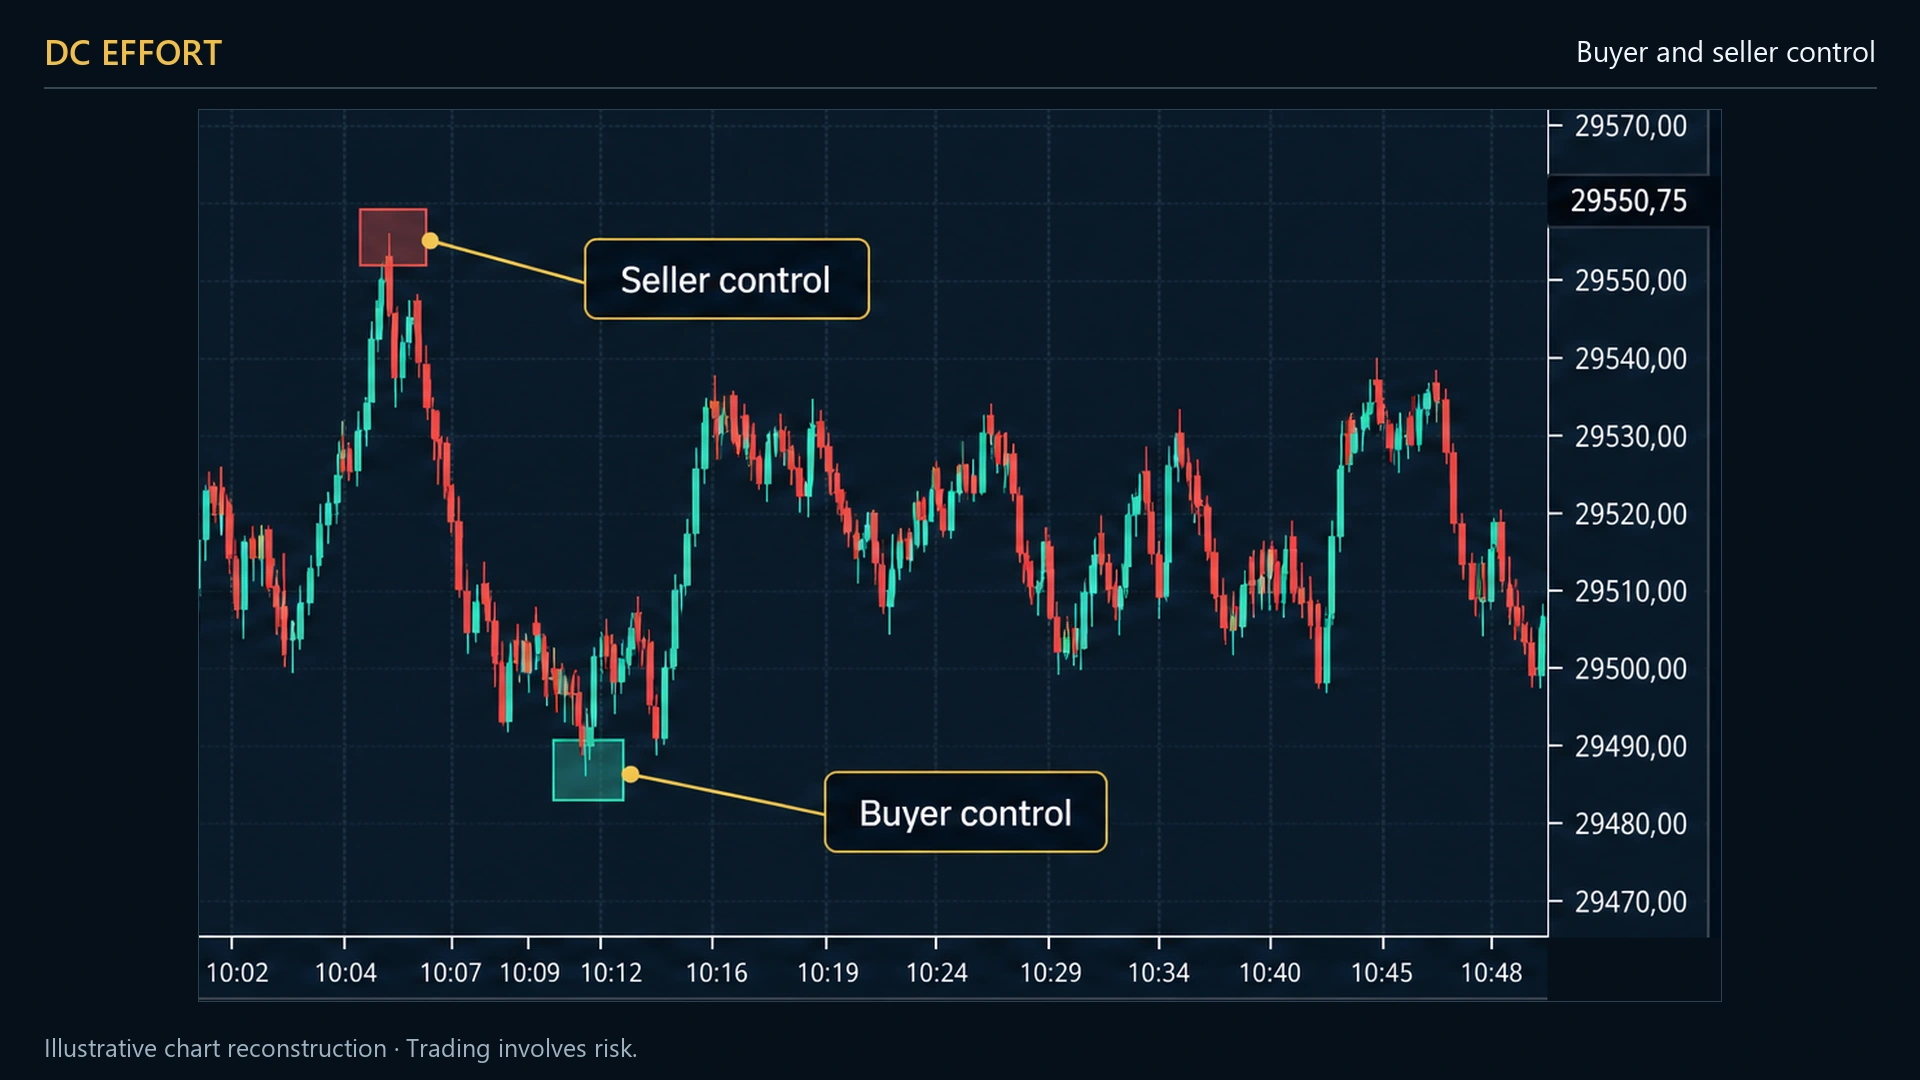
The one thing: a zone marked x3
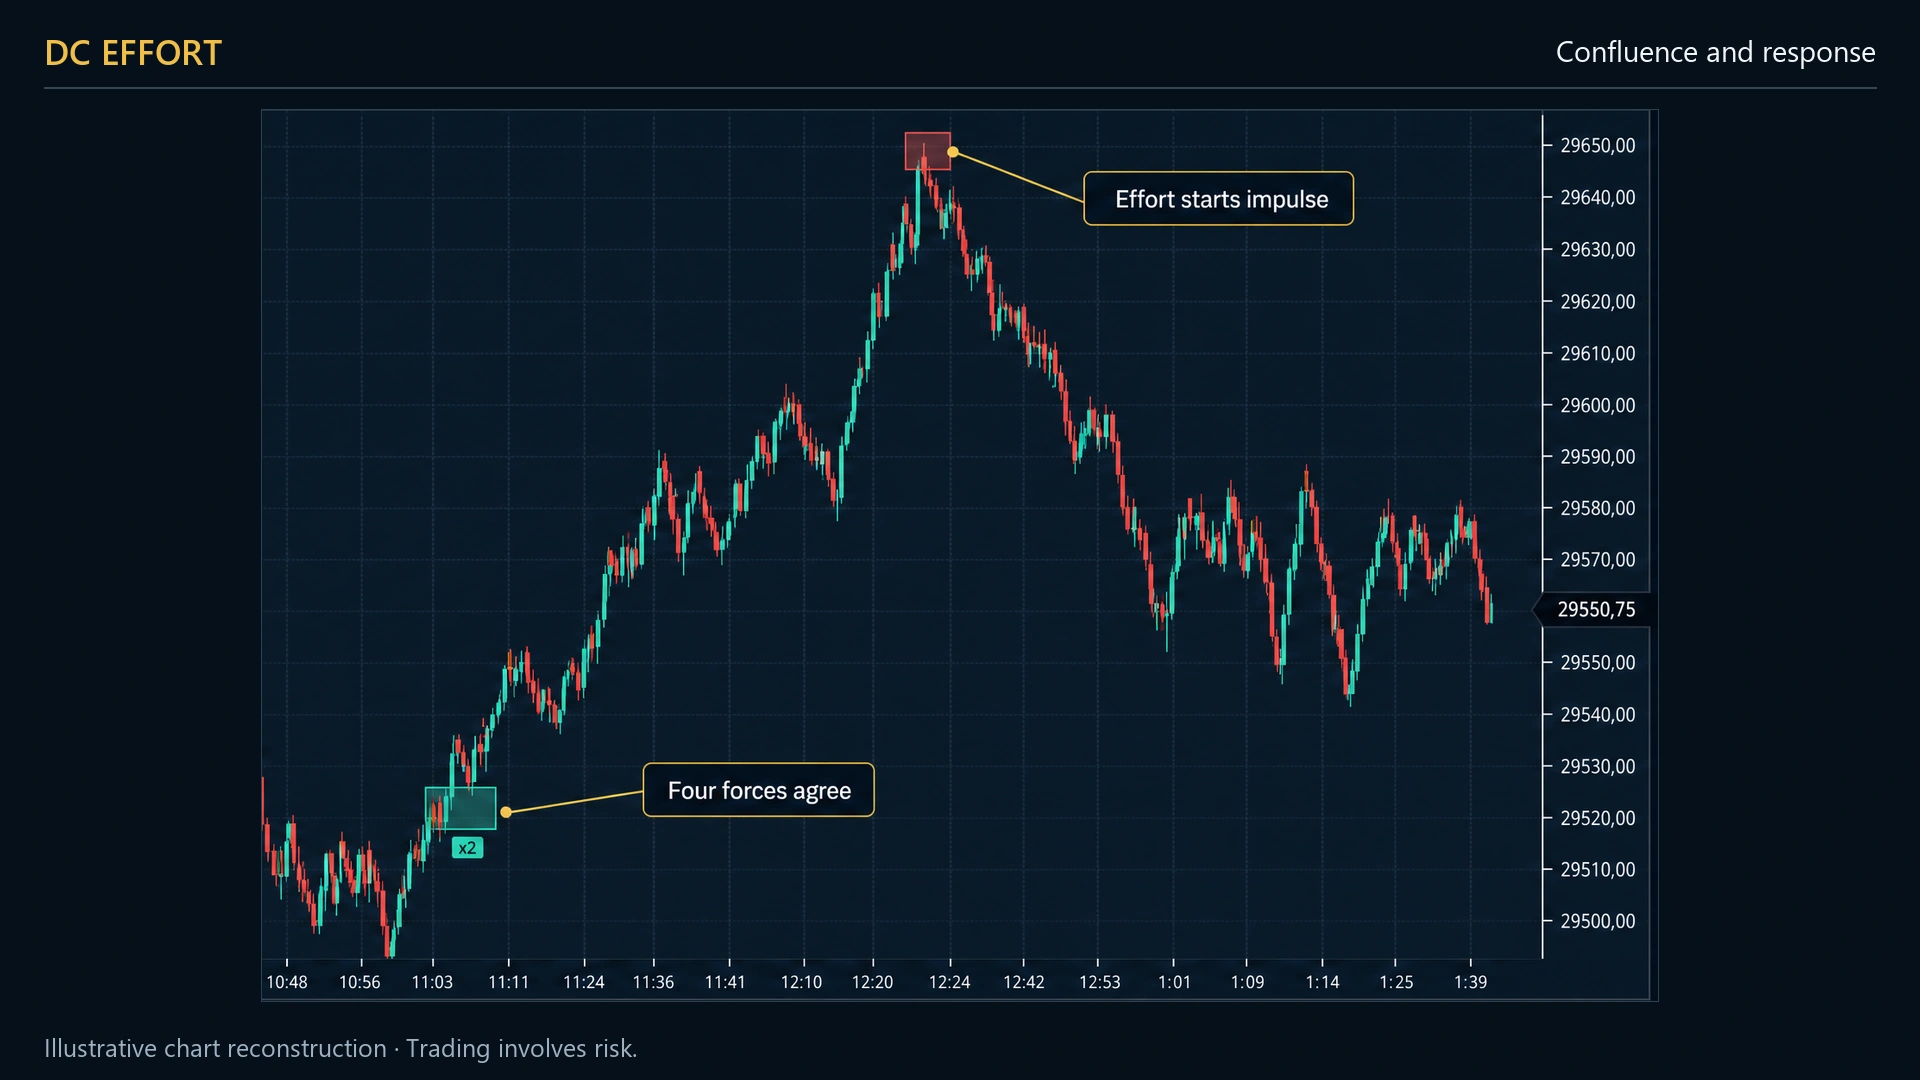
A single absorption is common and tells you very little. The same price defended three or four separate times is a participant. That repetition is the whole product.
When several same-direction absorptions occur at overlapping prices inside a forty-bar window, the zone carries a count: x2, x3, x4. And Minimum stack ships at 3 — meaning nothing at all is drawn below three. An isolated absorption never becomes a zone on this indicator.
Why that is harder than it sounds
The obvious way to build a stack counter is to count the zones already on the chart. That implementation is silently, permanently broken, and it is worth walking through because it is exactly what you are paying to have gotten right:
Absorption #1 arrives. It counts the zones at that price: zero. Below the minimum of three, so nothing is drawn. Absorption #2 arrives at the same price. It counts the zones: still zero, because #1 was never drawn. Nothing is drawn. Absorption #3 arrives. Counts zero. Nothing is drawn. For ever.
The chart would be empty on every instrument, on every timeframe, and no setting would fix it. The customer would assume the data was wrong.
DC Effort keeps two separate lists. One holds the zones you can see. The other holds every absorption event, whether or not it became a zone — pruned on a rolling window, walked backwards from the current bar, stopping at the stack window, counting only same-direction events whose price range genuinely overlaps the candidate. That second list is the reason a stack can ever reach three. It is four lines of code, and it is the difference between a feature and a feature that works.
How the defaults were chosen
The defaults are not a guess. They come from a study on 26 trading days of NQ 15-Range data, split into a training set and a separate verification set. Three of the things that study found are visible in the software rather than described on this page — you can check every one of them inside ten minutes of installing.
Require absorption ships on. It takes the direction from absorption alone and bypasses the composite score. The score is still calculated, still shown in the panel, still exposed to your strategy — it just does not print the zone.
Grades to show ships set to all three. The grade did not prove predictive, so it is information beside the zone rather than a gate in front of it.
It came out slightly negative on the data, so it is there to be switched on deliberately, not discovered and switched off.
What is left is the stack. Minimum stack ships at 3, because that is the one measurement the defaults trust. This is how one set of research decisions was made on a limited sample. It is not a performance claim and it is not a prediction. Every threshold is exposed so you can repeat the work on your own instrument — see Research mode below.
What you see on the chart
Six things are drawn, and that is the complete list.
| Element | What it means |
|---|---|
| Green rectangle | A buy control zone — the passive side defended this price band. Geometry is configurable: the bar range, the value area, or the control half (low to POC). |
| Red rectangle | A sell control zone, same three geometries. |
| Grade label | A x5, B x3, C — the quality grade, and the stack count when it is above one. The count is the part that matters. |
| Stack label | x3 on its own. Drawn only when the grade label is switched off, since the grade label already carries the count. |
| Score label | The aggregate score to two decimals. Off by default. |
| Info panel, top left | All four forces live, the score, the grade, how many forces were active, how many agreed, how much they conflicted, the stack count, the direction of the day, bar volume and bar delta. |
| Fill opacity | Graded, not flat: a B zone paints at 60% of your setting, a C zone at 35%. At the default the boxes are a wash, not a block — price stays readable through them. |
| Extension to the right | A zone extends right until a bar closes beyond its protected edge — or until 20 bars have passed, whichever comes first. |
| A sentence, bottom left | Drawn instead of zones when Order Flow+ is missing or the chart type is unsupported. It tells you which of the two it is. |
Optional alert on a new zone, with a chosen .wav file. Real-time only — it will not fire walking through history.
How to use it
A worked example, so you can see the shape of the trade
This is how the zone is read at the desk. It is an illustration of method, not a recommendation and not a signal — DC Effort marks the level, and every decision after that is yours.
A zone prints where effort went in and the result did not follow: heavy volume, a decisive delta, and price refusing to travel. That is one side committing size and getting nothing back. The rectangle sits on the prices where they took control and held it.
Wait for price to come back to the zone rather than chasing the bar that made it. The zone is a level, and a level is worth something when it is retested. Take the entry on your own trigger — a rejection, a shift in the tape, whatever your plan already uses.
Below the zone on a long, above it on a short, plus your instrument's normal noise. The rectangle gives you a defined invalidation drawn by the market rather than a round number: if price closes through the level, the side that was in control there is no longer in control.
A common way to size it is 1:1.5 — one and a half times the distance from entry to stop. Structure comes first: if the next level sits before that, take the level. The point is that the stop is defined before the target, not after.
Backtest it on your own instrument before you size up
We publish no win rate, no expectancy and no equity curve, and that is deliberate: a number produced on someone else's instrument, session and risk model tells you nothing about yours. What DC Effort gives you is an objective, repeatable level — drawn the same way every time, on rules you can read on this page — and that is exactly the kind of thing you can test.
Run it in NinjaTrader on the instrument and session you actually trade, with your own stop and target rules, and let your own data tell you where it fits your plan. The CSV log is there so you can do that properly rather than from memory. Structure, discipline, and a rule you can repeat — that is what the indicator is for.
It is not a black box
Two things here exist because we expected to be asked to prove the numbers.
Readable directly from your own strategy, with no screen scraping and no re-implementation:
ForceAggression, ForceAbsorption, ForceImbalance, ForcePath, EffortScore, ControlDir, LastBuyBoxLow, LastSellBoxHigh, StackCount.
The last two give you the active zone’s boundary as an objective reference level. All nine keep unlimited lookback.
One checkbox writes a semicolon-separated CSV of every bar’s raw ingredients — not just the bars that produced a zone. Test your own thresholds in Excel or Python without reloading NinjaTrader.
One thing to know: the file is opened when the indicator loads its data. Switch the setting on and then reload the indicator, or you will find no file.
Fifty-one columns per bar: OHLC and range, volume, delta and delta percent, relative volume, the running averages, follow-through and close position, efficiency, POC, VAH and VAL, imbalances and stacked imbalances counted at three different ratios, all four force values, the score, the active and agreeing counts, conflict, grade, direction, EMA and session VWAP with distances in ticks, session high and low, and position in the session range.
Requirements
Read this table before you buy. It is the one that prevents refunds.
| Platform | NinjaTrader 8, Windows |
|---|---|
| Order Flow+ required | Yes — and there is no fallback |
| Both calculation paths read NinjaTrader’s volumetric API. Without Order Flow+ (or a Lifetime licence, which includes it) the indicator draws a sentence explaining why instead of drawing zones. It does not estimate bid and ask from anything else. | |
| Tick Replay | Not required. What you do need is historical tick data from your data provider — set “Days to load” accordingly. |
| Chart types | Order Flow Volumetric directly, or Minute / Second / Tick / Volume / Range, where a volumetric series is added in the background automatically. Renko is not supported, and neither is any bar type outside that list. |
| Instruments | Any instrument where the volumetric API returns real bid and ask volume at each price — index futures, energy, metals, treasuries, crypto futures. Guidance, not a specification: spot forex has no centralised volume, so treat it as unsuitable. |
| Calculation | On bar close. Nothing is evaluated inside a forming bar. |
| Settings | 70 settings across fourteen sections, reachable from a single toolbar button. Edits apply and repaint the existing zones without a chart reload. |
| Price | $459 one-time, lifetime updates |
What it does not do
You are going to find all of this out anyway. Better here than on a funded account.
There is no arrow, no entry, no exit, no target and no position size — not as a setting, not as an option, not anywhere in the file. It measures order-flow state and marks zones. What you do with that is your edge, not ours.
Minimum stack ships at 3: three same-direction absorptions must overlap in price inside forty bars before anything is drawn. On a slow instrument or a slow session that is a long, silent nothing — and the indicator is behaving perfectly. Minimum stack is the knob. Lower it to see more, and understand that you are looking at weaker evidence.
Because Require absorption ships on, direction comes from absorption alone and the composite path is bypassed. The score threshold, the agreement and conflict limits, the grade thresholds and the active-force minimum still drive the score, the panel and the exposed series — but not which zones print. We would rather tell you than have you call it a bug.
When price closes beyond the protected edge the zone is deactivated, drawn one final time, and never touched again. No cross, no fade, no recolour. If you want a broken level flagged, this is not that tool.
A zone stops extending after 20 bars even if price never invalidated it. Above 150 zones on the chart, the oldest is removed along with its labels. So the precise claim is a zone is written at the close of its bar and its price never moves afterwards — not that a zone is never removed.
The indicator suspends while its chart tab is behind another. If you keep it on a background tab expecting alerts, you will not get them. Alerts are real-time only in any case — nothing fires on historical bars.
Absorption is a measurement of refusal. In a clean directional impulse there is very little of it to detect, by design. This is a tool for the part of the day where price is being fought over.
No backtest, no win/loss tracking, no built-in performance panel. The only output beyond the drawing is the nine series and the research CSV.
What it pairs with
If you already own DC Absorption Levels, here is the distinction in one sentence.
DC Absorption Levels draws a line at every single price where a vertical bid-versus-ask test passed. DC Effort ignores single absorptions entirely — it stays silent until three of them, in the same direction, overlap at the same price inside forty bars, and then draws a zone.
One gives you the complete map of every wall in the recent past, and you decide which ones matter. The other refuses to speak until a wall has been rebuilt three times, and hands you a count instead of a judgement. Traders who run both use the map for context and the zone for attention. Traders who run one usually pick by temperament: Absorption Levels if you want to see everything, DC Effort if your problem is that you see too much.
Both are part of the order flow suite, and both are included in the founder bundle.
Frequently asked questions
Do I really need Order Flow+?
Yes, and there is no way around it. The indicator reads bid and ask volume at every price level of every bar. That data comes from NinjaTrader’s volumetric API, which Order Flow+ enables. Both calculation paths depend on it. Without it, nothing is drawn and a sentence appears on the chart telling you so. A Lifetime NinjaTrader licence includes Order Flow+.
Do I need Tick Replay?
No. Tick Replay is not required and switching it on will not change what you see. What you do need is historical tick data from your data provider, so the volumetric bars can be built — set “Days to load” high enough for the history you want.
Why is my chart empty?
Four possible reasons, in the order you will meet them. First, an unsupported chart type or no Order Flow+ — this one announces itself with a sentence on the chart. The other three are silent: fewer than 20 bars loaded for the averages to warm up; bar volume below the minimum of 25; and, most often, Minimum stack at its default of 3, which requires three same-direction absorptions overlapping in price inside forty bars before anything is drawn. On a quiet session that is a long silence and it is correct behaviour. Lower Minimum stack to 1 or 2 to confirm the data is flowing, then put it back.
Does it repaint?
Here is the precise answer, because the imprecise one always has a counter-example. It calculates on bar close, so a zone appears only once its bar is complete, and its price never moves afterwards. What can change is its extension: it stops extending when a bar closes beyond it, or after 20 bars, whichever comes first. And once there are more than 150 zones on the chart, the oldest one is deleted to keep the chart usable. So a zone’s geometry is fixed at birth; a zone’s presence on the chart is not permanent.
Why do some settings seem to do nothing?
Because Require absorption ships on, which is how the indicator was calibrated. In that mode the zone direction is taken from the absorption force alone and the composite four-force path is bypassed, so roughly ten settings — the score threshold, the forces-in-agreement and conflict limits, the grade thresholds, the minimum active forces and the relative-volume minimum — no longer change which zones appear. They still drive the score, the info panel and the public series. Switch Require absorption off only if you have done your own work on your own instrument.
Does the session filter block my afternoon?
No. The session filter ships off. The window sitting in the two boxes beside it is only a default value doing nothing until you tick the checkbox — and if you do tick it as-is, it blanks what is the whole US cash session on ES and NQ. A filter you did not switch on should never be the reason your chart is empty.
Can I read it from my own strategy?
Yes. Nine values are exposed as public NinjaScript series with unlimited lookback: the four force values, the aggregate score, the control direction, the stack count, and the boundaries of the last active buy and sell zone. Reference the indicator from your strategy and read them directly.
Can I see the raw numbers behind a zone?
Yes — that is Research mode. It writes a 51-column semicolon-separated CSV of every bar’s raw ingredients, including imbalances counted at three separate ratios, so you can rebuild the logic yourself in Excel or Python and test thresholds without touching NinjaTrader. One thing to know: the file is opened when the indicator loads its data, so switch the setting on and then reload the indicator, or you will find no file.
Lock the founder price
Every indicator, the copier and the Telegram agent, lifetime, at $1,845 for the first fifty. No payment taken today.