DC Volume Profile $149 · DC Market Profile $449 · lifetime · no Order Flow+ needed
Market Profile and volume profile for NinjaTrader 8
In short: two indicators, sold separately, documented here together because they draw the same levels. DC Volume Profile draws a volume histogram per session, day or week with POC, VAH and VAL. DC Market Profile is its successor: it measures how much volume traded at every price and how much time the market spent at every price, and draws both on the same row grid — a histogram plus a real lettered TPO profile with initial balance, single prints, tails, poor extremes and a day type — over seven period types.
Requires NinjaTrader 8 on Windows. Neither one requires Order Flow+ — on DC Market Profile the add-on buys the bid/ask split and nothing else. Tick Replay is not required either.
Two indicators, and which is which
They are separate products at separate prices. This page covers both because running them together draws the same levels twice, and that is worth knowing before you choose.
| DC Volume Profile | DC Market Profile | |
|---|---|---|
| What it draws | A volume histogram at each price, with POC, VAH and VAL carried across the period and the price printed at the end of each line. Optional period high and low. | The same histogram, plus a real lettered TPO profile on the same row grid: brackets, initial balance and extension, single prints, tails and excess, poor highs and lows, split days, day types. Untested levels, volume nodes and developing lines on top. |
| Period types | Two — session or week (day by session definition), with a configurable number displayed. | Seven from one setting — session, week, composite days, rolling bars, fixed range, visible range, anchored. |
| Order Flow+ | Not required. Without it, each 1-minute bar’s volume is spread across its range rather than read from ticks. | Not required. Exact volume at price comes from a plain 1-tick series; the add-on buys the bid/ask split only. |
| Settings | 10 | 108, in eleven sections |
| Price | $149 lifetime | $449 lifetime |
NinjaTrader names: DCVolumeProfile and DCMarketProfile. Both are one-time lifetime licences covering three machines. DC Market Profile is in the Map Pack; DC Volume Profile is sold on its own, because a pack holding both would sell you the same job twice.
The morning this replaces
You are on a funded account, it is 09:05, and you want three things before the open: yesterday’s value area, the shape that produced it, and which POCs above and below have never been traded back to.
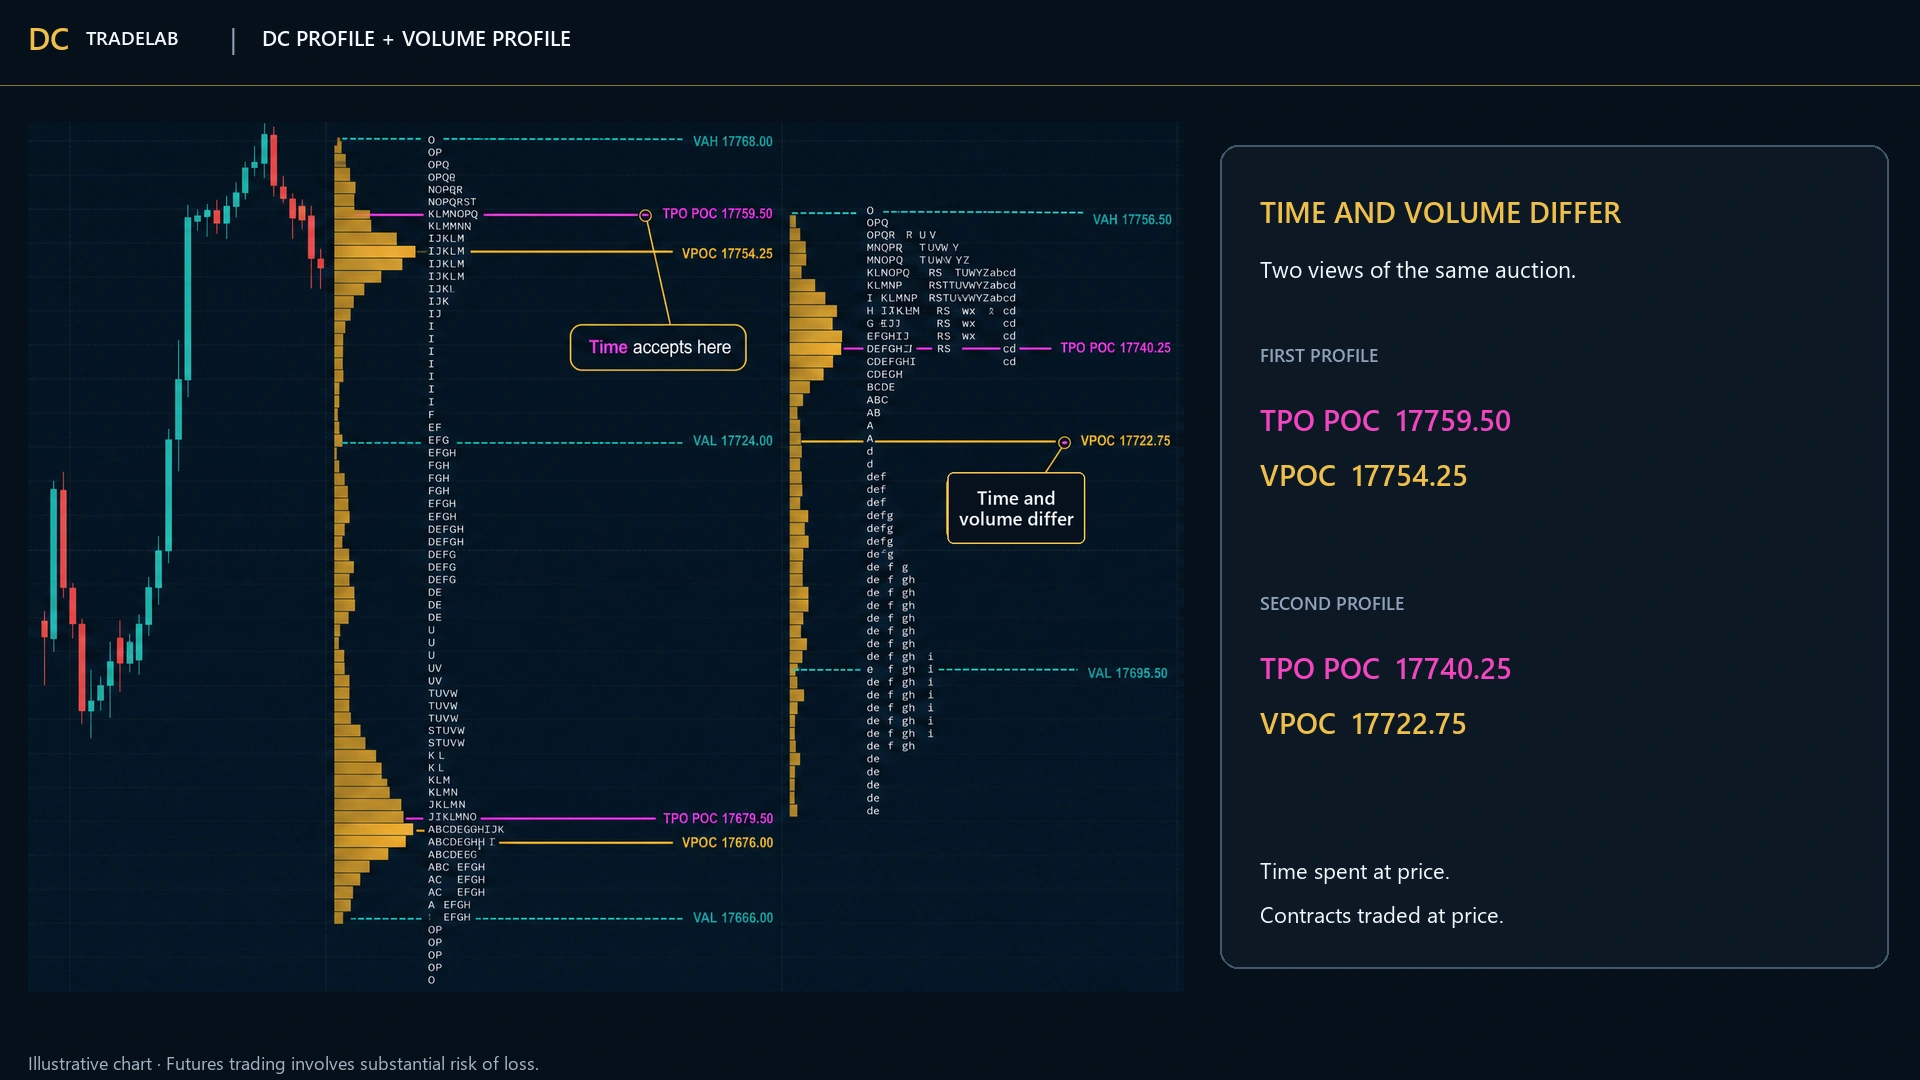
A volume profile gives you the histogram. Letters — brackets, initial balance, single prints, a day type — come from somewhere else, if you have them at all. The two bin prices differently, so the two magenta lines on your chart sit a row apart and you are left to decide which one you believe.
Most profile tools on NinjaTrader either need Order Flow+ or quietly hand you an estimate spread across a minute bar and call it volume at price. You pay for the add-on to get a histogram, when what the add-on actually sells is the bid/ask split.
Your value area holds a different number of rows than the one on the screen next to you, and neither tool will tell you which rule it used, whether it stops on the row that reaches the target or the pair that does, or which way it broke the tie.
The read a profile trader actually pays for is TPO POC against VPOC — time says value is here, money says value is there. That comparison is only honest when both engines accumulate over the same window, on the same row grid, in the same snapshot. Two separate indicators each own their own bin map, and you are asked to eyeball two lines and trust they were binned identically. That is the reason both engines live in one indicator in DC Market Profile, and the panel prints the gap between them as a number: TPO POC to VPOC -14 ticks.
DC Volume Profile — the session volume profile for NinjaTrader 8
The smaller of the two, and still the right answer for a lot of people. A daily volume profile with POC, VAH and VAL, ten settings, $149.
Volume traded at each price for the period, drawn from the start of the period rightward. Width is set as a percentage of the period, so it stays proportionate whether you are looking at one session or twenty.
Dashed lines across the whole period, each with its price printed at the end. The POC is where the most volume traded; VAH and VAL bound the value area, whose size you choose.
Optional, on their own toggle. Useful when you trade the extremes of the prior session rather than its value area.
Pick the period and how many of them to display. A week profile over a daily chart and a session profile over a 5-minute chart are the same indicator with one setting changed.
It works without Order Flow+
Most volume profile indicators simply stop if the volumetric data is not there. This one degrades instead.
| Data source | What you get |
|---|---|
| Volumetric (Order Flow+) | Real volume traded at each price. Every level is exact. |
| 1-minute fallback (automatic) | An approximation built from 1-minute bars. The shape of the profile and the location of the POC are right; the level-by-level detail is estimated. |
The switch happens by itself — there is nothing to configure and nothing to notice, beyond the fact that the tool loads on a plain NinjaTrader installation. It is one of five indicators here that do not need Order Flow+, together with DC Key Levels, DC Market Profile, DC VWAP and the free DC POC Candle.
Ten settings, on purpose
DC OrderFlow Chart has more than eighty parameters, because it does eight jobs. This one has ten, because it does one: shape (histogram width as a percentage of the period, ticks per level, value area percentage), source (real volume at price from the footprint, or the 1-minute fallback), and visibility (independent toggles for the histogram, for POC/VAH/VAL, for the period high and low, and for printing the price at the end of each line).
There is a real cost to a settings dialogue with eighty entries, and it is paid by the person who has to find one of them at 09:31. A tool with a single job should be configurable in under a minute.
| Platform | NinjaTrader 8, Windows |
|---|---|
| Order Flow+ required | No — falls back to a 1-minute approximation on its own |
| Tick Replay | Not needed |
| Periods | Session, day or week, with a configurable number displayed |
| Levels drawn | POC, VAH, VAL, period high and low |
| Settings | 10 |
| Price | $149 one-time, lifetime updates, 3 machines |
DC Market Profile — how it works
Four mechanisms, and none of them require an add-on to be licensed.
A bracket is defined by its high and its low. Both come out of a 1-minute series the indicator always adds, so the whole Market Profile side — brackets, letters, TPO POC, TPO value area, initial balance, single prints, tails, poor extremes, split days, day types, composites — is arithmetic over data every NinjaTrader licence already has.
A plain 1-tick series gives every trade at its exact price with its exact size. That is not an approximation of volume at price; it is volume at price. The indicator adds one when the volumetric series is not available, and prints on the chart which of the two it is using.
Prices become integer ticks, ticks become rows by a floor, and the same three functions are used in accumulation, in level computation and in rendering. Mixing floor and round between them is what puts letters half a row off the price axis — and it looks like a rendering bug when it is a binning bug.
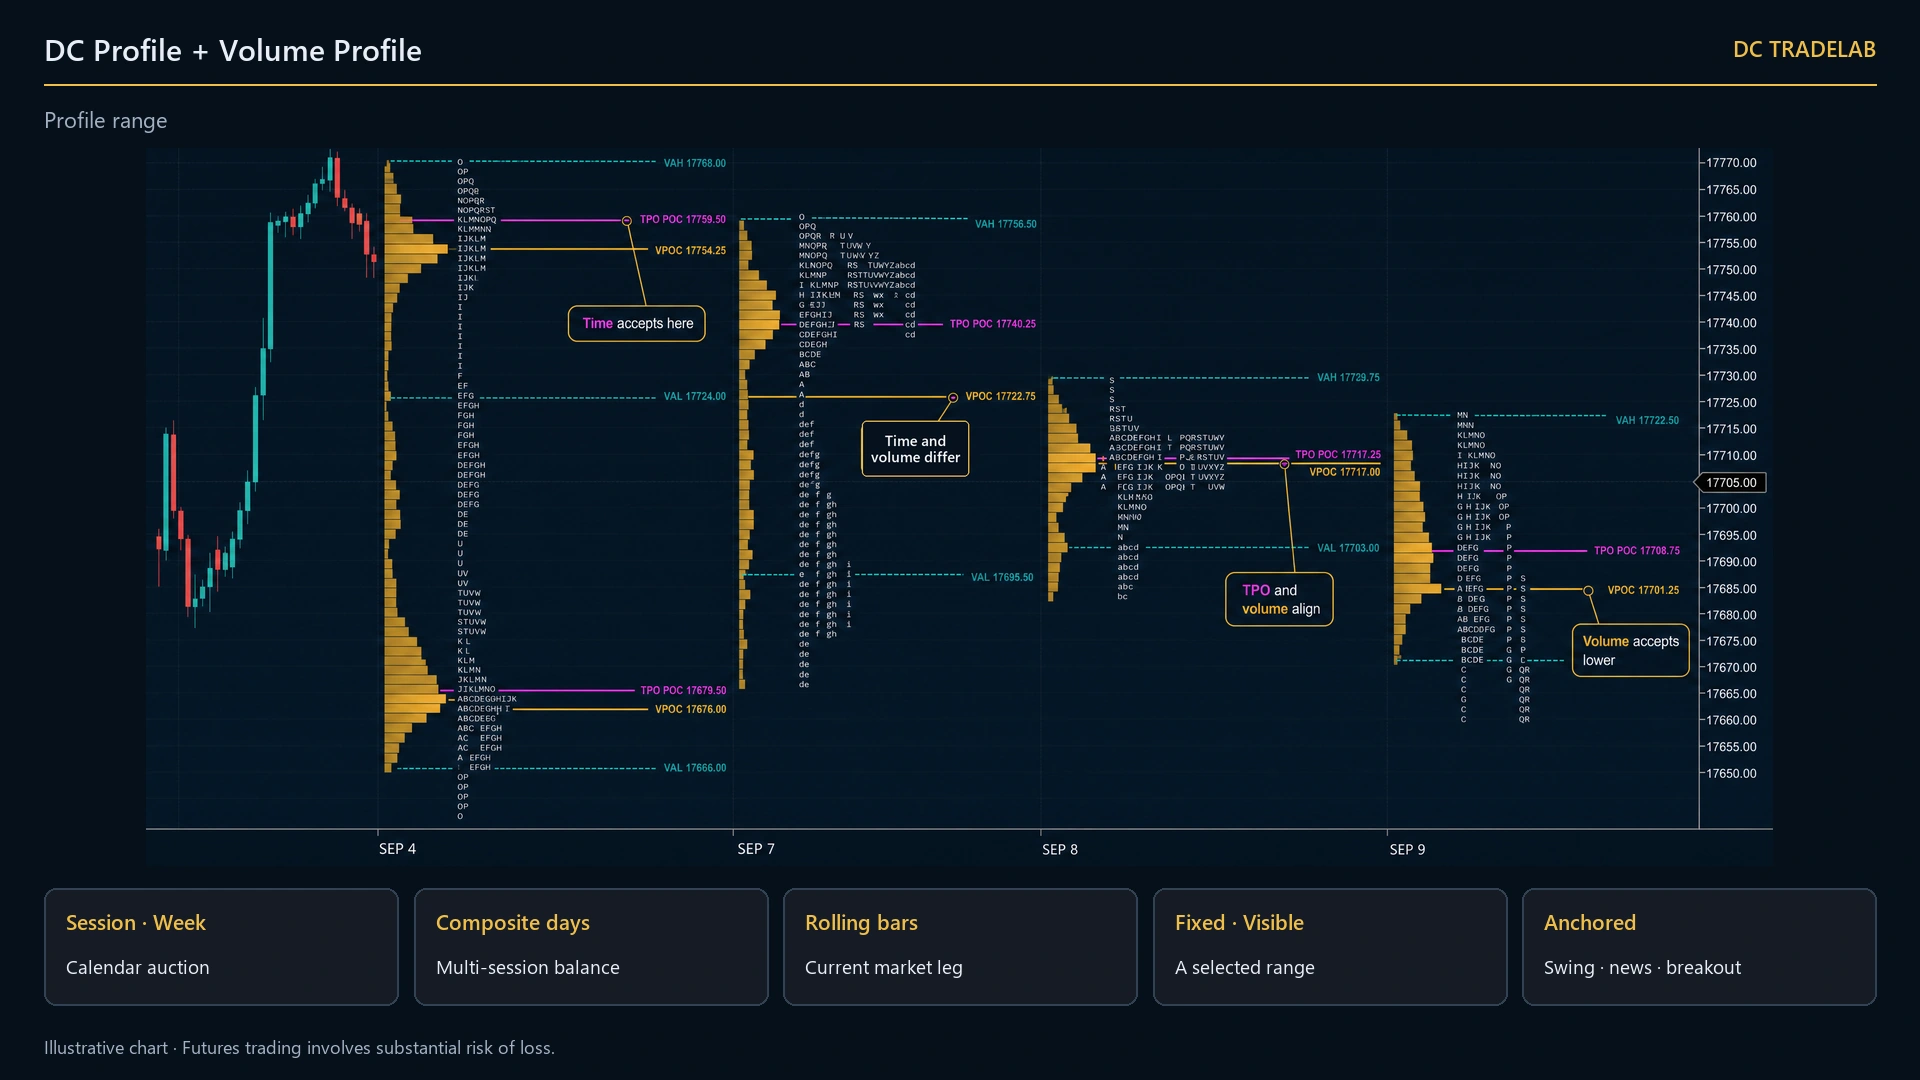
Session, week, composite days, rolling bars, fixed range, visible range and anchored are all summed out of the same 1-minute slices, so the value-area rule, the POC tie-break and the row grid cannot drift between profile types. A composite is the element-wise sum of its sessions, and its POC comes from the summed rows — never from averaging daily POCs, which produces a price that corresponds to nothing.
What the add-on actually buys
Order Flow+ buys exactly one thing: the bid/ask split — delta at price, the split profile, the delta POC, and volume confirmation of TPO excess. Falling back from the volumetric series to the 1-tick series costs you the split and nothing else. The POC, the value area, the nodes and the untested levels are the same numbers.
The chart says which path it is on, in the indicator’s own words: volume: exact (volumetric) · bid/ask: live, or volume: exact (tick) · bid/ask: unavailable (Order Flow+ not licensed), or, when it has been pushed onto the estimate, volume: ESTIMATED from 1-minute bars (weighted to close) — not volume at price. An estimate is never allowed to pass for a measurement: the profile is tagged, and the second POC is suppressed outright.
The value area is the CBOT pair rule, and we will tell you it overshoots
This is the paragraph to check us on. It takes ten seconds against the platform you already trust.
The value area is built by comparing the sum of the next two rows on each side and taking both from the winner — the rule Sierra Chart, ATAS, TradingView and NinjaTrader’s own volume profile use. It stops when the accumulated volume reaches the target, never when it merely passes it, so it legitimately overshoots inside the winning pair.
Which is why a real value area set to 70 commonly holds 72 to 74 rather than exactly 70. That is correct. It is not a rounding defect and we are not going to quietly trim it to make a screenshot look tidy — there is a Stop mid-pair switch, and that is what it exists to change.
The rest of the rule is decided rather than left to chance. A tie between the two sides expands upward, fixed, never left to whichever branch is hit first. A one-row remainder is clamped and taken as one row, not overrun. Under three rows it returns VAH = VAL = POC, never a VAH beneath a VAL. And the older single-row rule is kept as an option for exactly one reason: a trader migrating a DC Volume Profile template needs to reproduce his old levels.
The POC tie-break is the same quality of thinking. “First maximum wins” is never used, because it makes the POC depend on iteration order and jump between reloads. The default is the CBOT rule — the qualifying row nearest the midpoint of the window’s actual range, and on a second tie the lower price — with an epsilon so float noise cannot pick a different row. It is a setting, and the alternatives are named rather than hidden.
Put it beside the profile you already run, at one tick per row, and the levels should land on the same prices. That is the test we would run in your position, and it is the one this was built to survive.
What DC Market Profile draws on the chart
Everything below is drawn by the one indicator, switched by settings rather than by installing something else.
| Element | What it is | Default |
|---|---|---|
| Volume histogram | Volume traded at each price for the period, one row per Ticks per row, drawn as a histogram, an outline or both. | On |
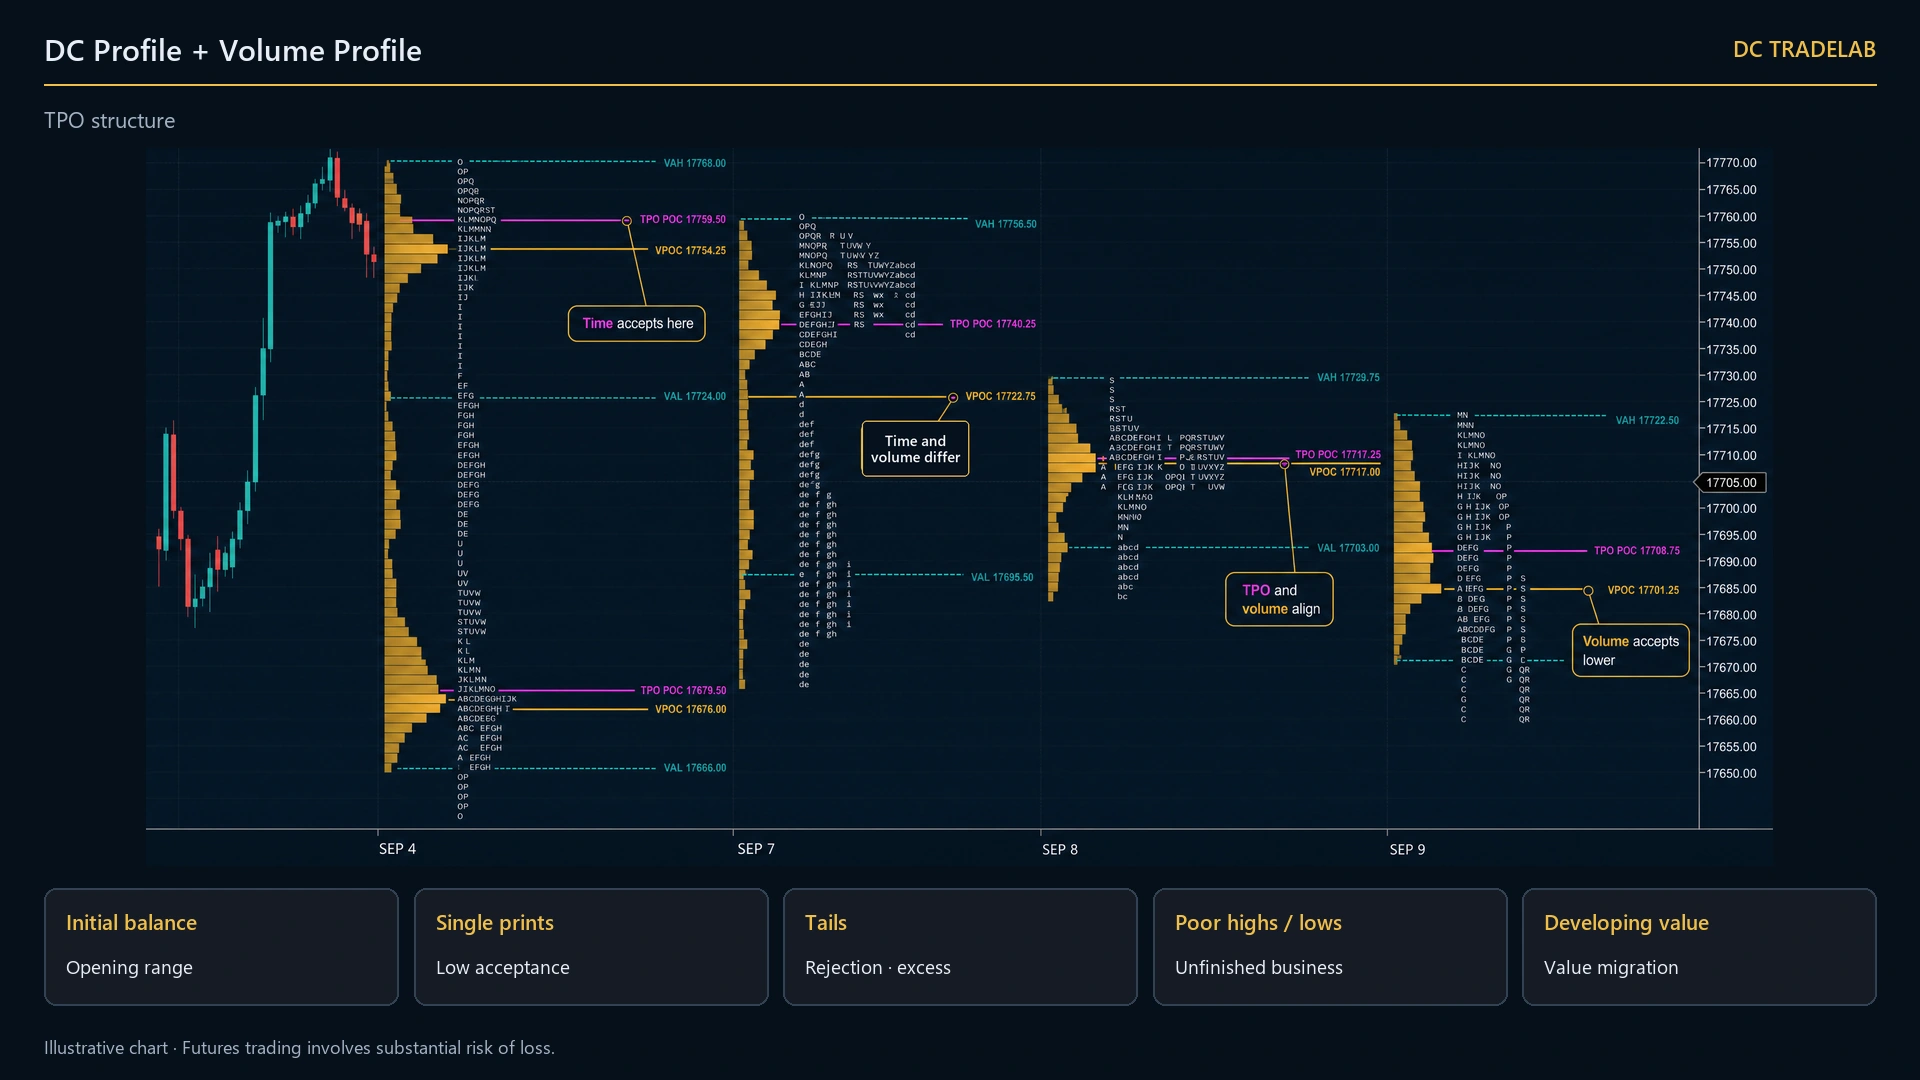
| TPO letters | One letter per bracket per row, A to Z then a to z, collapsed left or split into time columns. Blocks where letters would be meaningless. | TPO modes |
| POC | Magenta line on the row that traded most, or held most brackets. Named TPO POC when both profiles are drawn. | On |
| VPOC beside the TPO POC | The volume POC computed on the same rows by the identical algorithm, in a deliberately different colour. Suppressed on estimated volume. | TPO + volume |
| VAH and VAL | Value area bounds with the price printed at the end of each line, plus an optional shaded band. | On |
| Initial balance | IB high, IB low and optional extension levels, with the letter that first traded outside it. | On |
| Single prints | Rows a single bracket touched, marked in cyan, with a minimum run length you set. | On |
| Tails and excess | Marked at the extremes, on a strict or a loose definition, and classified against the outermost rows that actually carry a TPO. | On |
| Poor high / low | An extreme flat enough that the outermost row carries the number of TPOs you set. Red. | On |
| Day type | One word at the close: NORMAL, NORMAL VARIATION, TREND, NON-TREND, NEUTRAL CENTRE, NEUTRAL EXTREME. Withheld while the session is open unless you ask for the running read, which is prefixed prov. | At close |
| Untested levels | nPOC, nVAH, nVAL carried forward until price trades into them, with a tolerance in ticks and a rule for gaps. | Off |
| HVN / LVN and developing lines | High and low volume nodes, and where the POC and value area stood bar by bar. | Off |
| Statistics panel | POC 5842.25 VAH 5851.00 VAL 5833.75 width 69 ticks, the IB figures, the structure count, the day type, and TPO POC to VPOC in ticks. | Off |
| The data-source line | Top left. Names the mode, the letter state, the volume path, the bid/ask state and whether a setting is waiting on a reload. | On |
108 settings in eleven sections, reached from one toolbar button labelled Profile. In plain volume mode the two Market Profile sections are not emitted at all, which removes 27 rows from the dialogue.
DC Market Profile requirements
Read this table before you buy, not after.
| Platform | NinjaTrader 8, Windows |
|---|---|
| Order Flow+ required | No. The TPO side is arithmetic over a 1-minute series, and exact volume at price comes from a plain 1-tick series. Order Flow+ adds the bid/ask split only — delta at price, the split profile, the delta POC, and volume confirmation of TPO excess. |
| Tick Replay | Not required and not enforced. Its state is read once and reported on the chart line: Tick Replay OFF — historical volume differs from what was recorded live. Nothing is refused and nothing is left blank. |
| Chart and bar types | Any, Renko included. The 1-minute series is added unconditionally, so the profile is byte-identical on a 1-minute, a 5-minute or a Renko chart. A chart that is already Order Flow Volumetric is read directly instead of adding a second series. |
| Instruments | Any futures instrument NinjaTrader charts. Ticks per row is what you tune per instrument — 1 shows every single print and is correct on ES, 2 to 4 keeps NQ and CL readable. It is not cosmetic: it changes the counts, the POC and the value area boundaries. |
| Periods | Session, week, composite days, rolling bars, fixed range, visible range, anchored — one setting |
| Settings | 108, in eleven sections, from one toolbar button |
| Price | $449 one-time, lifetime updates, 3 machines |
Which one do you need
The honest version, so you can stop reading early if the cheap one is the right one.
If all you ever want is a volume histogram with POC, VAH and VAL over a session or a week, DC Volume Profile at $149 already does that and DC Market Profile adds nothing you asked for. Everything else on this page — the TPO side, the five other period types, the configurable value-area and POC rules, untested levels, nodes, developing lines — is the reason to spend $449 instead.
You want yesterday’s POC and value area on the chart, you tune it once and never open the dialogue again, and ten settings is a feature rather than a limitation. $149.
You want TPO letters and the day type, composites and rolling windows, ranges or anchors, untested levels carried forward, volume nodes, or the TPO POC against the VPOC as a number. $449.
They draw the same levels twice on one chart. DC Market Profile is the successor; DC Volume Profile keeps working unchanged and is not being retired. Buy one, or put them on different charts.
Buying the smaller one first is not a wasted step: move up to a pack later and what you already paid comes off the pack price. The pricing page sets out the packs and the upgrade credit.
What DC Market Profile does not do
This is the section we would read first, so it is written the way we would want to read it.
No alerts. Not one, in 5,841 lines. It will never sound, pop up or write to say price reached a level. No arrows, no score, no direction of any kind — every string it draws is a name, a price, a tick count or a day-type word. If you want to be told, that is DC Key Levels or DC Absorption Levels, not this.
Profile mode, Profile type, TPO period, Session source and Volume source change how the data is loaded and accumulated, so they only take effect once the indicator reloads. The bracket is stamped at accumulation time; moving the grid live would put two different half-hours on one letter. The chart says setting changed — reload the indicator to apply rather than looking broken.
A week, a composite, a rolling window or a range draws blocks, because bracket A of Monday and bracket A of Tuesday are unrelated and letters there would be decoration pretending to be information. Past 52 brackets the letters stop too — it never wraps back to A, and it prints the period length that would fix it.
An untested level is removed the moment price trades into it. Nothing turns dashed, nothing changes colour, and a retired level never comes back. DC Key Levels does the dashed-when-broken treatment; this does not.
Anchored and Fixed range both resolve to the current bar out of the box and keep only what comes after it. You have to set the anchor before either draws a thing. That is deliberate, and it still surprises people on the first afternoon.
The developing POC and value area are skipped on a profile past roughly two thousand rows or three thousand slices, because the per-bar recompute is not worth the frame. On a twenty-day composite they simply will not draw, with no message.
On Auto without Order Flow+ a 1-tick series is loaded even in pure Market Profile mode, which needs no volume at all. On a long history that is a real load cost for someone who only wanted letters. The fix is in the product — set Volume source to One minute (estimated) — but you should know it before you meet it.
Profile history (days) bounds memory; it does not shorten NinjaTrader’s own load. If loading is slow, shorten Days-to-load on the chart. And Visible range rebuilds every time you pan, by design.
Do not run it on the same chart as DC Volume Profile. They draw the same levels twice. DC Volume Profile is not removed and not broken — saved templates bind by class and property name, so yours keeps working — but the two belong on different charts, or one of them belongs in the bin.
If you already own something here
Where these two overlap the rest of the suite, stated plainly.
| If you own | Then |
|---|---|
| DC Volume Profile ($149) | Same job, smaller. Two period types against seven, ten settings against 108, no TPO, no untested levels, no nodes, no composites, and without Order Flow+ it spreads each minute bar’s volume evenly rather than reading ticks. DC Market Profile is its successor. Run one or the other, not both. |
| DC Key Levels ($399) | Real overlap, stated plainly: Key Levels already draws POC, VAH and VAL for recent sessions and already tracks untested ones, on the same test rule. Key Levels draws a clean line map and is light on any chart. DC Market Profile draws the distribution those lines came out of, and can carry untested levels from composites, ranges and anchors that Key Levels has no concept of. Running both duplicates the daily POC line. |
| DC POC Candle (free) | POC Candle answers where volume concentrated in this bar. These two answer where it concentrated over the session, week, composite, window, range or anchor. Put both on and the per-bar mark reads against the period’s POC and value area. |
| DC OrderFlow Chart ($499) | A footprint inside every bar, which needs volumetric data. A profile aggregates across bars and needs no add-on for its core. The microscope and the map; neither replaces the other. |
| DC VWAP ($299) | The other answer to “where is value” — one volume-weighted number per bar with deviation bands. A profile is a distribution with a mode. When the two sit at the same price that is one thing, and when they do not it is another. |
Frequently asked questions
Do I need Order Flow+ for a volume profile in NinjaTrader?
Not for either of these. DC Volume Profile reads real volume traded at each price from the volumetric data when it is there, and builds an approximation from 1-minute bars automatically when it is not — the profile shape and the POC location are reliable either way, and the level-by-level precision is what the volumetric feed adds. DC Market Profile does better still: exact volume at price comes from a plain 1-tick series, so the add-on is not required at all.
What is the difference between POC and VPOC?
They are the same thing under two names — the price at which the most volume traded during a period. “VPOC” makes the volume basis explicit, which matters when the alternative is a TPO profile. DC Volume Profile is volume-based throughout. DC Market Profile draws both a TPO POC and a VPOC, which is exactly why it names them separately.
Can a session volume profile show several sessions at once?
Yes. You set how many periods to display and each gets its own histogram with its own POC, VAH and VAL. Overlapping POCs across consecutive sessions are one of the more useful patterns this reveals.
Does it work on a daily chart?
Yes. Set the period to week on a daily chart and you get weekly profiles. The period and the chart interval are independent settings.
What does Order Flow+ add to DC Market Profile, then?
Exactly one thing: the bid/ask split — delta at price, the bid/ask split profile, the delta POC, and volume confirmation of TPO excess. Falling back to the 1-tick series costs you the split and nothing else. The POC, the value area, the nodes and the untested levels are the same numbers.
Do I need Tick Replay?
No. It is never required and never enforced. Its state is read once and reported on the chart line, so you know whether historical volume differs from what was recorded live. Nothing is refused and nothing is left blank.
Does it work on Renko and other non-time bars?
Yes, on any bar type. The 1-minute series is added unconditionally, so the profile is byte-identical on a 1-minute, a 5-minute or a Renko chart. A chart that is already Order Flow Volumetric is read directly instead of adding a second series.
Why does my value area hold 72 rows when I set 70?
Because the value area follows the CBOT pair rule: it compares the sum of the next two rows on each side and takes both from the winner, stopping when the target is reached rather than when it is passed. It therefore overshoots inside the winning pair, and 72 to 74 rows is the normal result. That is correct and it is what every other pair-rule platform does. If you want it to stop halfway through the winning pair, turn on Stop mid-pair.
Why are my letters showing as blocks?
One of three reasons, and the chart says which. Either Profile style is set to Blocks; or the profile type is not Session, because bracket A of Monday and bracket A of Tuesday are unrelated; or the session produced more than 52 brackets and the alphabet ran out. In the last case it prints the TPO period that would fix it rather than wrapping back to A.
I already own DC Volume Profile. Do I need DC Market Profile?
If a volume histogram with POC, VAH and VAL over a session or a week is genuinely all you want, no. If you want TPO letters, composites, rolling windows, ranges or anchors, a configurable value-area and POC rule, untested levels carried forward, volume nodes or developing lines, then yes — and put them on different charts, because together they draw the same levels twice.
Why is a volume profile not part of Key Levels?
Because one draws volume and the other draws levels, and combining them would mean everyone pays the render cost of both. Splitting them also means you can buy the $149 tool if that is the one you need.
Can I buy today?
Not yet. Checkout opens once the licensing client and the payment provider are finished. Until then the founding list locks a lower price, and no payment is taken.
Before the open
The work that decides the day is done before the bell.
A session volume profile with POC, VAH and VAL, or TPO letters and the histogram on the same row grid over seven period types. You arrive at the session with the map already drawn — value, the point of control, the untested levels — and you spend the session trading rather than measuring.
Lock the founder price
Every indicator, the copier and the Telegram agent, lifetime, at $1,845 for the first fifty. No payment taken today.