$299 lifetime
VWAP for NinjaTrader 8, anchored where you want it
In short: DC VWAP measures the volume weighted average price from an anchor you choose — session, week, month, quarter, year, a rolling window of N bars, or one bar you pin — and draws that line, up to three bands built from the volume weighted standard deviation of price around it, and the previous period’s closing VWAP kept on the chart as a flat level.
Why pay for a VWAP? NinjaTrader’s own VWAP sits inside the paid Order Flow+ add-on and follows the calendar. This one reads nothing but the chart’s own open, high, low, close, volume and time, so it runs on a plain NinjaTrader licence — and it lets you put the anchor on the bar that actually mattered.
Requires NinjaTrader 8 on Windows. No Order Flow+, no Tick Replay, no volumetric bars, no second data series.
The problem, on a Tuesday morning
You are in NQ from 09:47. Price is thirty points away from where you got filled, and you want to know one thing: relative to what the market has actually paid, is this still the cheap side or are you now the late money?
A session VWAP answers that against a session which started ninety minutes ago. It says nothing about the balance that has been building since Thursday’s low — the level every trader on your feed is talking about. To measure from Thursday’s low you have to anchor there, and a session VWAP cannot.
Then there is the width of the bands. The usual way to draw them is a standard deviation of the closes, which counts a bar that traded twelve contracts exactly as heavily as a bar that traded twelve thousand. Run that through the overnight and the bands arrive at the cash open already stretched to a width the day session never had, and every reading you take off them that morning is wrong by the same amount.
And if you never bought Order Flow+, there is no VWAP on the chart at all.
How it works
Three running sums, one pass over the bars, and the anchor applied at the moment a value is read rather than when the bar is calculated.
From the first bar it has, the indicator keeps three running totals — volume, price times volume, and price squared times volume. They are never reset.
Any anchor is then the difference between two entries in those arrays. A year-anchored VWAP costs the same as a session one, and switching between them repaints immediately — no reload, no re-applying the indicator.
The bands are multiples of the volume weighted standard deviation of price about the VWAP, not of a plain standard deviation of close. A quiet overnight session does not widen them.
Session boundaries come from the instrument’s own session template, not from the calendar date — so a Sunday evening open belongs to Monday’s session. The schedule window also has to contain the bar before it is believed: asked about a time sitting inside a weekend, a holiday or a maintenance break, NinjaTrader answers with the session that follows it, and taking that answer unchecked would file the last hours before a holiday under the day after.
On tick, volume, range and Renko bars a bar carries the timestamp of its last trade, which moves while the bar builds — so one bar can start in the old period and finish in the new one. That bar’s period is decided again on every tick rather than once. It is the reason the chart you watched all morning and the same chart after a reload agree with each other.
And where the weighting cannot mean what a VWAP normally means — equal weight selected, an instrument reporting no volume, a feed reporting tick counts rather than contracts — it says so on the chart rather than draw a line that quietly means something else.
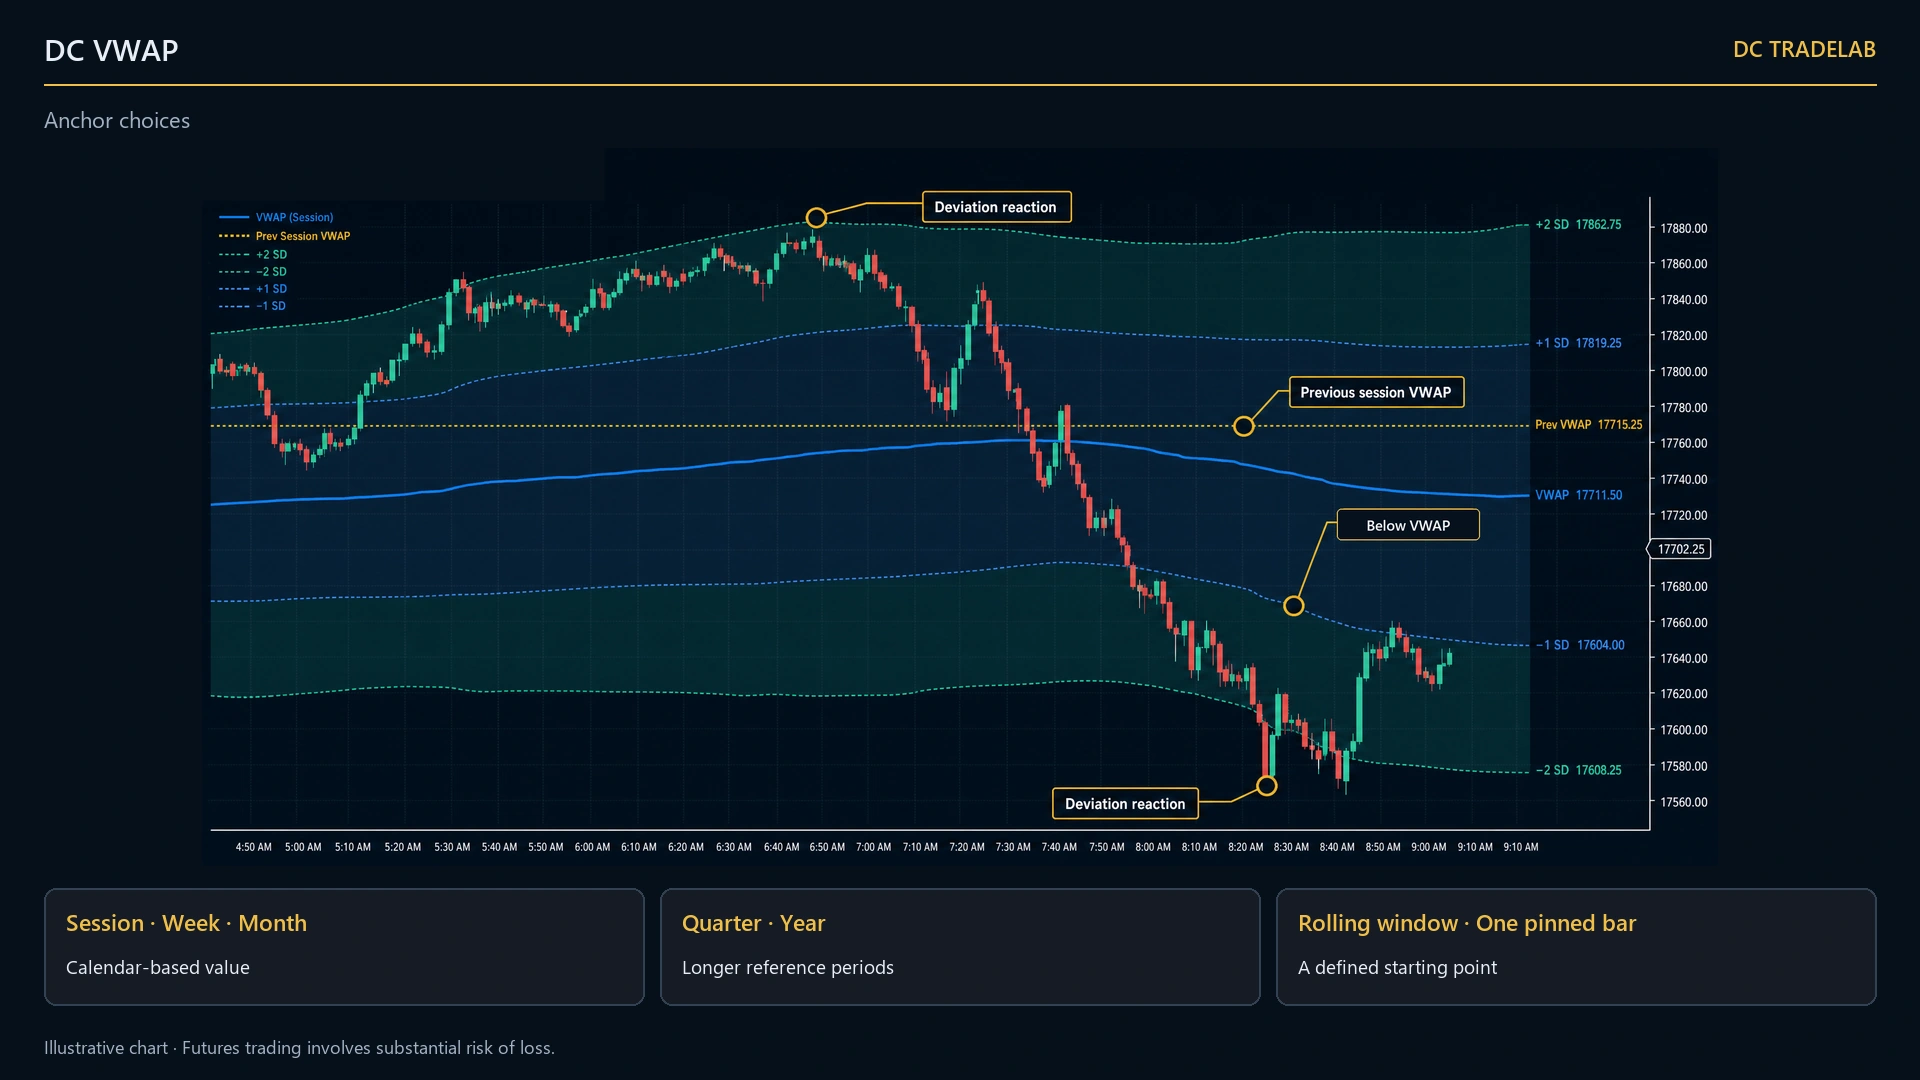
The one thing: the bands are computed in a shifted coordinate system
This is the part anyone who can read C# can check in ten seconds, and the part a VWAP assembled from a tutorial gets wrong without ever noticing.
To get a standard deviation you have to accumulate price squared times volume. On an index future trading around 5,000, that sum reaches the order of 1016 across a year of bars — and the variance underneath is the difference between two numbers of that size. In double precision, that subtraction throws away most of the significant digits you had. The line still looks right. The bands quietly go wrong, and they go wrong further the further back you anchor.
DC VWAP reduces every price by the price of bar 0 before it multiplies by volume and squares, and adds that offset back again only at the end. Working in small numbers keeps the deviation honest over thousands of bars on a seven-thousand-point instrument. Its companion sits one line away: a variance that comes out fractionally negative — which a run of identical prices can produce, a few units in the last place — is clamped before the square root, because a NaN there takes the whole line off the chart.
Neither of those is visible in the output, and neither is the kind of thing that gets added later. Both are written out, with their reasons, above the code that does them. If that is the standard you want the rest of an indicator built to, this is the paragraph to judge it by.
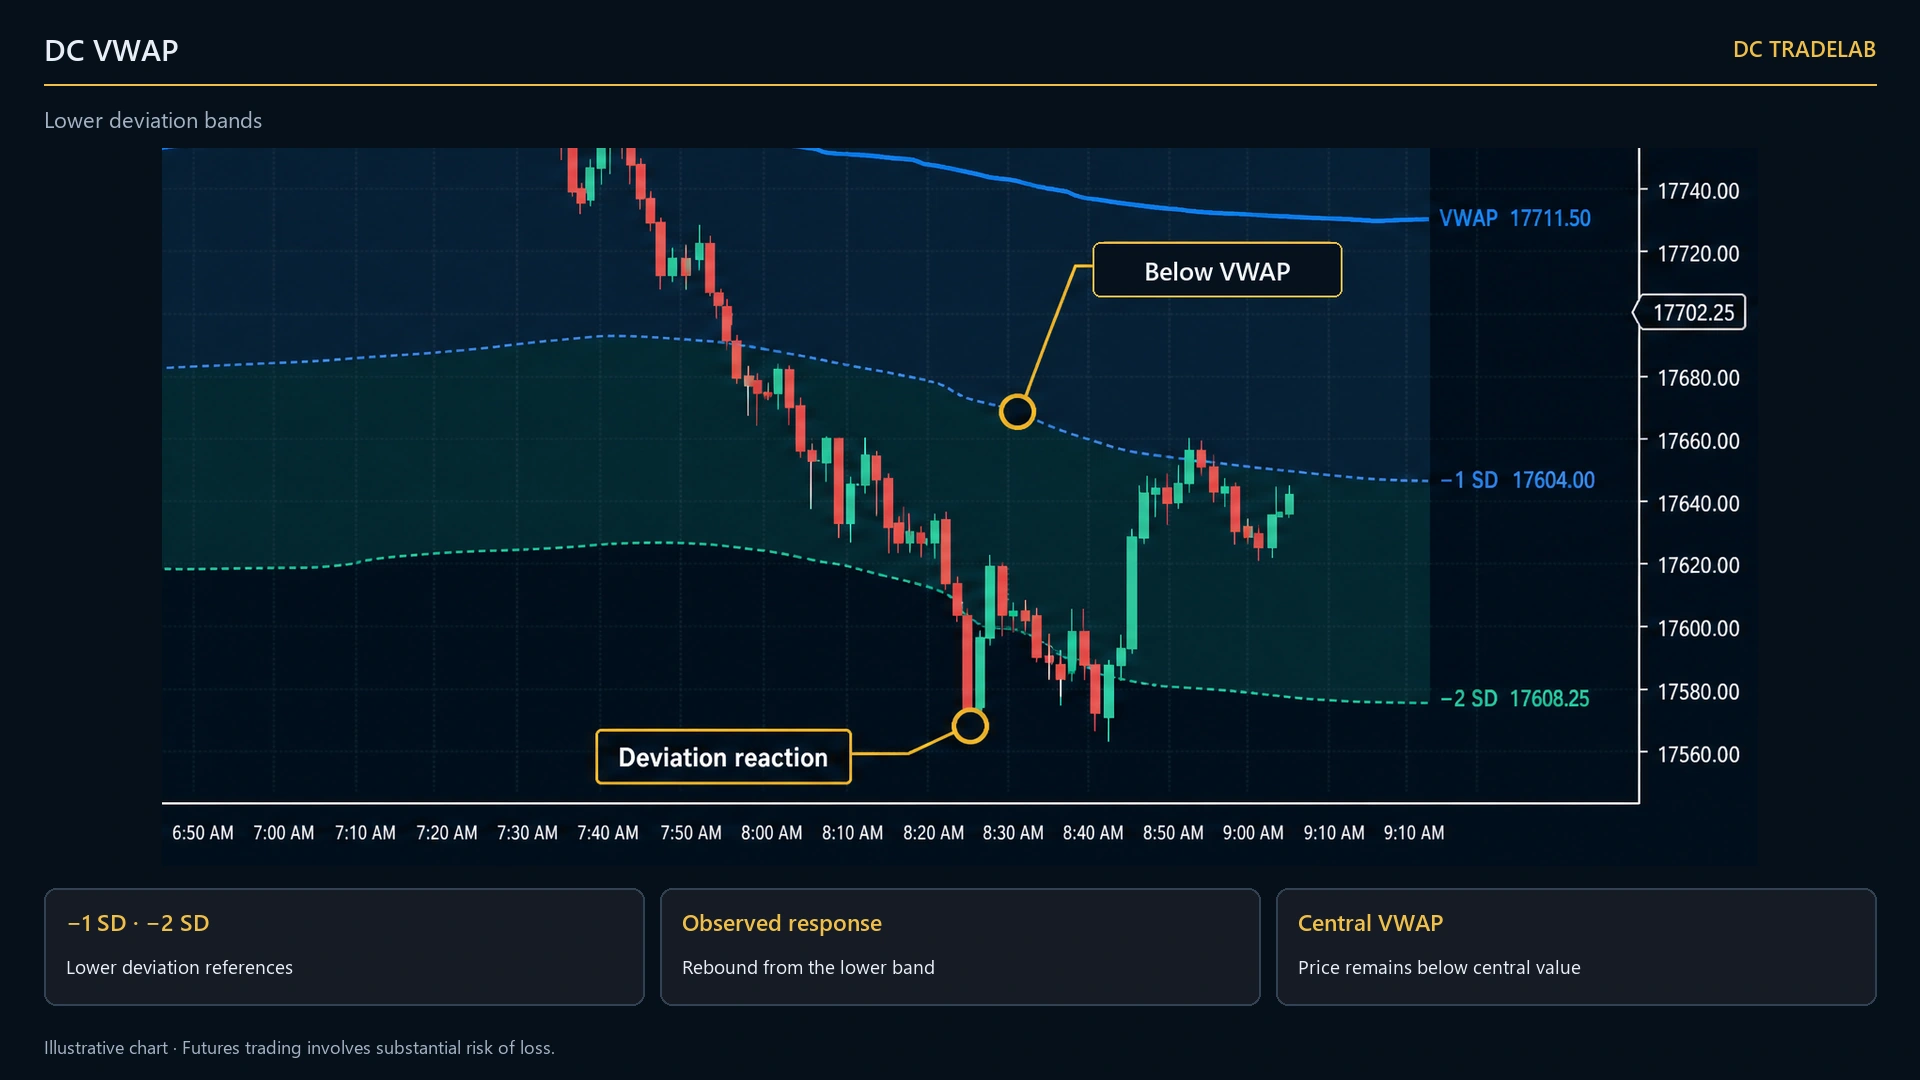
What you see on the chart
Seven things, all of them optional, all of them at shipped defaults below.
| Element | Default | What it is |
|---|---|---|
| VWAP line | DodgerBlue, solid, 2px | The live volume weighted average price from the anchor to the current bar. It moves with every print and extends to the right edge. |
| Band 1 | 1.0 ×, RoyalBlue, dashed | One volume weighted standard deviation above and below, captioned +1 SD and -1 SD. |
| Band 2 | 2.0 ×, Teal, dashed | Two deviations out. Band 3 (3.0 ×, purple, dotted) is available and off by default. |
| Band fills | On, 12% and 8% | Shaded strips drawn between neighbours — VWAP out to band 1, band 1 out to band 2 — never one on top of another, so the opacity setting means what it says. |
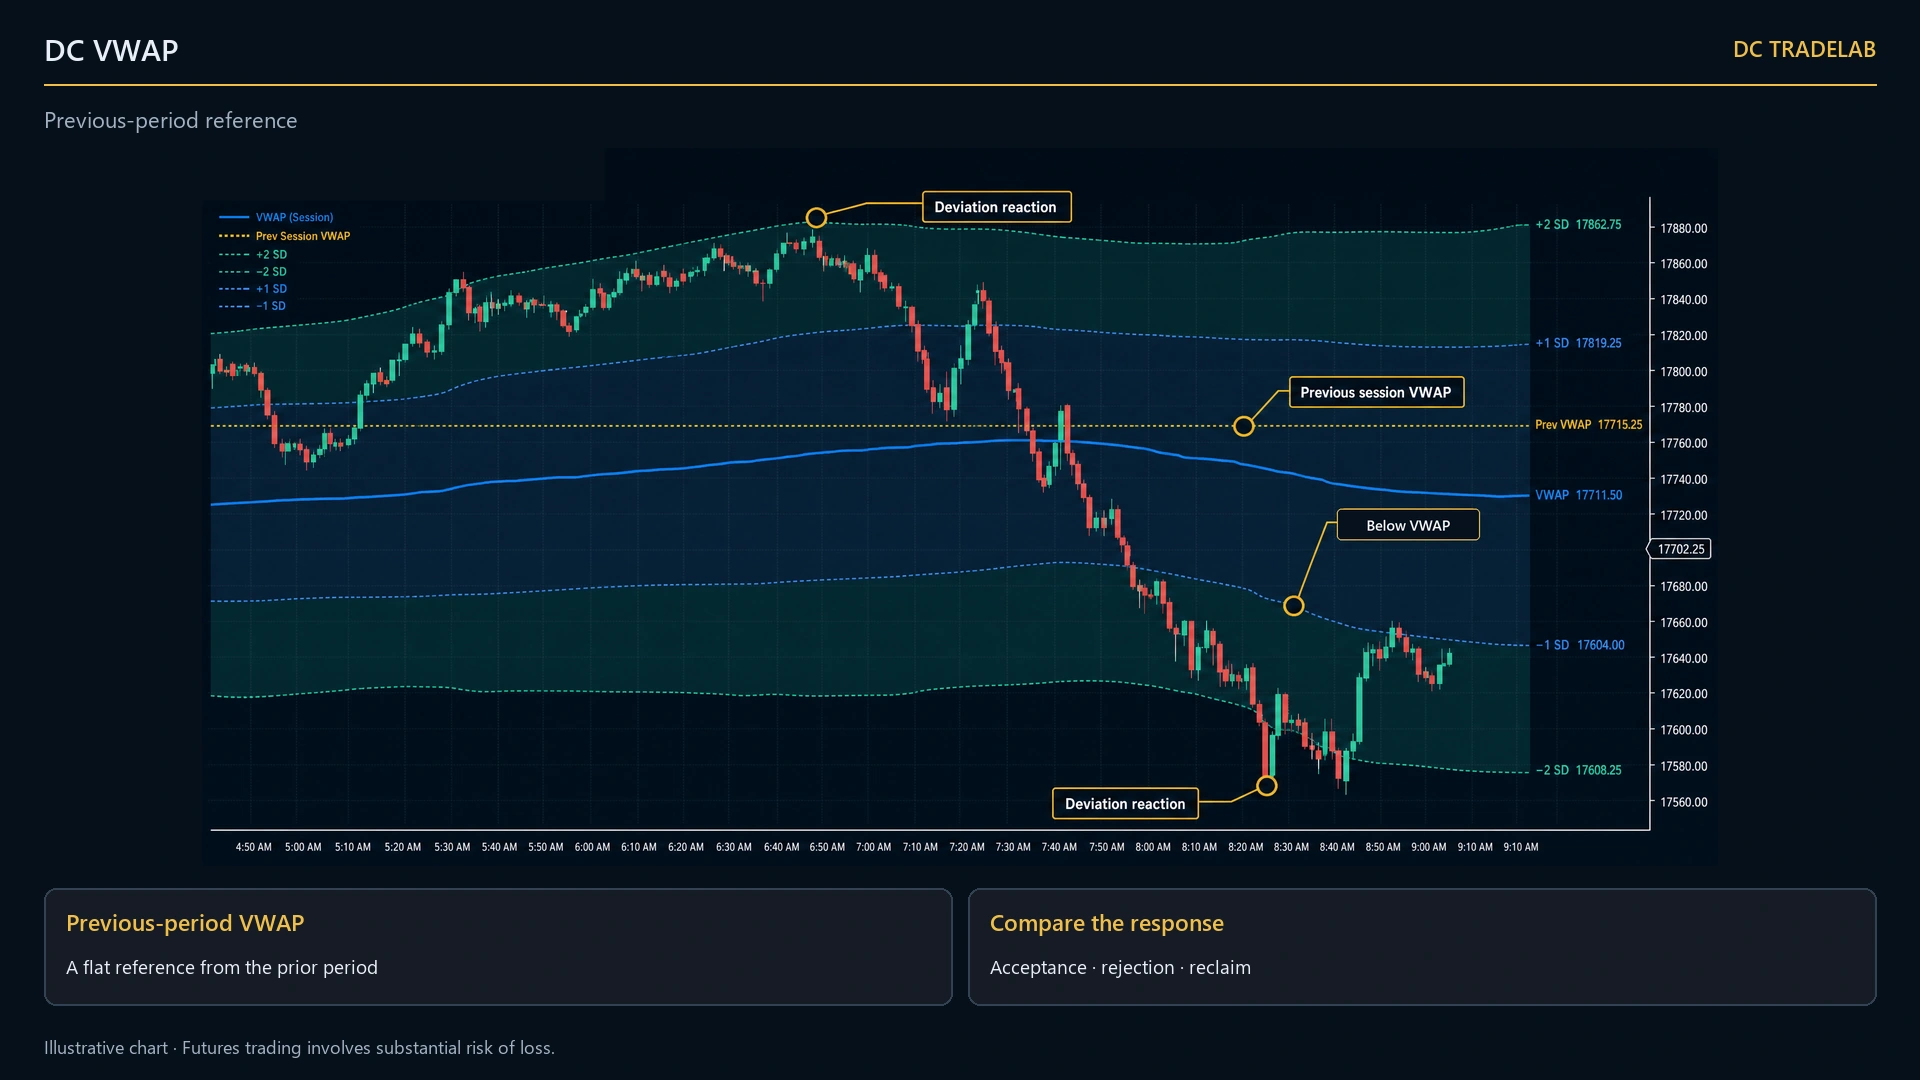
| Previous period VWAP | Gold, dash-dot | The closing VWAP of the period before, kept as a flat level and captioned Prev session VWAP, Prev week VWAP, and so on. |
| Anchor note | On | One line at the top of the panel naming which anchor is actually running, how many periods it found, how many days of history are loaded and where the boundaries came from: DC VWAP — anchor: Session · 23 periods across 23 loaded days · boundaries: from the instrument’s session template |
| Line labels | On, with price | Every run is labelled at its own right-hand end, not only the newest one — scroll back a screen and the readings are still named. VWAP 5012.25 |
43 settings in 7 sections, reached from a single VWAP button on the chart toolbar. The toolbar window and NinjaTrader’s own F6 dialog are built from the same names in the same order, so they cannot disagree about what anything is called. Price input can be typical, median, close or average; band basis can be standard deviation or a straight percentage of the VWAP.
Requirements
This table is the one to read before you pay. It is short on purpose.
| Platform | NinjaTrader 8, Windows |
|---|---|
| Order Flow+ required | No. Nothing degrades without it. Every input comes from the chart’s own open, high, low, close, volume and time, plus the instrument’s session template. |
| Tick Replay | Not required, for historical bars or for real time. The arithmetic is one observation per chart bar, so a bar that closed before the indicator loaded is fully usable. |
| Extra data series | None. One instrument, one series — no background one-minute or volumetric feed is added. |
| Bar types | All of them. Minute, second, tick, volume, range and Renko included — there is no chart-type restriction anywhere in the indicator. |
| Instruments | Anything whose feed reports volume — ES, NQ, RTY, CL, GC and the rest. On spot FX, where feeds report tick counts rather than contracts, the line is a tick weighted average price and the chart says so. |
| Price | $299 one-time, lifetime updates |
What it does not do
You will find all of this out in the first week anyway. Better here.
A NinjaScript indicator has no way to receive a chart click — the chart hands mouse input to drawing tools and the chart trader. The anchor bar is typed as a number of bars ago instead. If that is a deal-breaker, it is one now rather than after you pay.
One anchor field, one line, one pinned bar. To see a session VWAP and a weekly VWAP together you add the indicator to the chart twice.
One observation per chart bar: a 1-minute chart resolves the average to the minute, a 30-minute chart to the half hour, and the difference is largest early in a period. It is not the figure an exchange settlement uses.
The weight is the bar’s reported volume, not volume at price. It knows nothing about bid or ask, and it is not trying to.
No sound, no notification of any kind when price reaches a band. It exposes no NinjaScript plot and appears in no data box. Three public methods exist as an extension point for your own code; nothing in the suite calls them today.
No arrows, no scores, no directional colour. Three lines above a mean, three below, and a level from the period before. It is a measurement of where volume traded, not an instruction.
And four rough edges, because you would find them anyway.
The previous-period level exists only for the calendar anchors. A rolling window or a pinned bar has no previous period and gets none. The chart does not rescale for the indicator either, so band 3 can sit off the visible range and stay there.
Set band 2’s multiple below band 1’s and band 2’s shading stops drawing, with no message on the chart. The lines still draw, so it looks half-broken. Keep the multiples in ascending order.
Change the anchor, the price input or the volume source from the VWAP toolbar button rather than the F6 dialog. Both work; through F6 the full pass over the loaded bars runs on the chart’s drawing thread and can hold a multi-year minute chart for the length of it.
And the anchor note tells you which anchor is running — not which bar a pinned anchor landed on.
What it pairs with
One real overlap in the suite, and it is worth being precise about.
DC Key Levels already draws yesterday’s closing VWAP. It comes from a background one-minute accumulation, independent of whatever timeframe your chart is on, and it arrives as one more line on a map of levels. DC VWAP gives you the live line, its dispersion bands, and any anchor you choose, accumulated on the series you are actually looking at.
The one-sentence test: if you want yesterday’s finished number as one more level, Key Levels already has it and you do not need this; if you want today’s moving line, how far price is from it, and an anchor that is not the session, that is this.
On a 30-minute chart the two previous-session figures will not be identical, because they were accumulated at different resolutions. That is expected, not a defect. One practical note if you run both: they ship the same DodgerBlue solid 2px default — change one of them, so today’s moving line and yesterday’s finished one are not the same colour.
A POC is a mode — the single busiest price. A VWAP is a mean. They can disagree, and the disagreement is the information. No shared code, no conflict.
The only other indicator in the suite that needs no Order Flow+. POC Candle marks the busiest price inside each bar; DC VWAP averages across bars from an anchor. Different scales entirely.
Those need Order Flow+ and a volumetric series. DC VWAP does not — which makes it the one you can run on the day you install it, before you have decided whether to pay NinjaTrader for the add-on.
Frequently asked questions
Do I need Order Flow+ or Tick Replay?
Neither. No volumetric series, no bid/ask lookup, no second data series — every input is the chart’s own open, high, low, close, volume and time, plus the instrument’s session template. Historical bars work immediately, with no reload and no Tick Replay flag to remember.
How is this different from NinjaTrader’s own VWAP?
Four things. It needs nothing from the Order Flow+ add-on. It offers seven anchors, two of which are not calendar periods at all — a rolling window of N bars, and one bar you pin. Its bands come from the volume weighted standard deviation of price about the VWAP, not a plain standard deviation of close. And it keeps the previous period’s closing VWAP on the chart as a level.
Can I click the chart to place the anchor?
No, and the reason is structural: a NinjaScript indicator never receives mouse input — the chart routes clicks to drawing tools and the chart trader, and an indicator is only asked to render. You type the anchor as a number of bars back, and it stays on that bar until you re-type it.
My VWAP does not reset at the session open. Is it broken?
Almost certainly not. Read the note at the top left of the chart. If it says anchor: Session followed by a period count, the reset is working. If it says Year, RollingBars or AnchoredBar, that is the anchor coming back from a saved chart or workspace template — open the VWAP toolbar button and set Anchor to Session. A year anchor on a chart holding less than a year of data gives exactly one period, which looks identical to a session VWAP that never restarts.
Does it work on Renko?
Yes, and on every other bar type — there is no chart-type restriction anywhere in it. The case where a bar’s timestamp moves while it builds, which tick, volume, range and Renko bars all do, is handled explicitly.
Can I show a session VWAP and a weekly VWAP at once?
Add the indicator to the chart twice, with a different anchor and colour on each. There is one anchor field per instance and one pinned bar; it does not keep a stack of anchored lines.
Is it the same number the exchange settles on?
No. Accumulation is one observation per chart bar, so a 1-minute chart resolves it to the minute and a 30-minute chart to the half hour, and the gap is widest in the first bars of a period. That sentence also ships inside the settings window, not only here.
What happens on spot FX or an instrument with no volume?
On spot FX, where feeds report tick counts instead of contracts, the line is weighted by ticks traded rather than by size, and the chart says so. On an instrument reporting no volume at all it falls back to equal weight and labels the line as an unweighted average; force the volume source to bar volume there and it draws nothing rather than draw something misleading.
Lock the founder price
Every indicator, the copier and the Telegram agent, lifetime, at $1,845 for the first fifty. No payment taken today.